Advanced Signal Detection Software
Experience state-of-the-art CFAR detection algorithms for reliable signal identification in varying noise environments
Khanfar Spot Scanner - CFAR Edition
Advanced Signal Detection with CFAR Technology for RTL-SDR, Airspy, and HackRF Devices
Software Overview
Khanfar Spot Scanner - CFAR Edition is a cutting-edge Software Defined Radio (SDR) application featuring advanced Constant False Alarm Rate (CFAR) detection algorithms for reliable signal identification in varying noise environments. This professional-grade software combines real-time spectrum visualization with sophisticated signal detection capabilities, allowing users to identify signals that would otherwise be missed by conventional fixed-threshold methods.
Advanced Plugins for Enhanced Capability
The base software includes powerful fixed-threshold detection, while premium plugins enhance its capabilities:
- CA-CFAR & OS-CFAR Algorithms: Advanced adaptive threshold detection techniques for superior performance in varying noise environments and crowded spectrum conditions
- Sequential Probability Ratio Test (SPRT): Statistical detection algorithm that makes optimal decisions as evidence accumulates, providing superior performance for weak signals and fluctuating noise conditions with quantifiable confidence metrics
- IQ Recording: Capture and save raw I/Q data with comprehensive metadata for detailed offline analysis
- Telegram Integration: Remote monitoring with real-time alerts, signal history management, and advanced analytics delivered directly to your mobile device
Each plugin can be activated individually to customize the software to your specific monitoring requirements.
What is CFAR Detection?
Constant False Alarm Rate (CFAR) detection is an adaptive threshold technique widely used in radar systems and advanced signal processing applications. Unlike traditional fixed-threshold detection methods, CFAR dynamically adjusts detection thresholds based on the local noise environment, maintaining consistent detection performance even when noise levels fluctuate.
The software implements two primary CFAR variants:
- Cell-Averaging CFAR (CA-CFAR): Uses the average of surrounding cells to estimate noise levels
- Ordered-Statistic CFAR (OS-CFAR): Uses ranked statistics (percentile values) for improved performance in environments with multiple signals
Fixed threshold detection uses a single threshold level across the entire spectrum. This works well in stable environments but can lead to missed detections or false alarms when noise levels vary.
CFAR detection dynamically adjusts thresholds based on surrounding cells. For each Cell Under Test, nearby Reference Cells estimate local noise level (excluding Guard Cells). This adaptive approach maintains detection performance even when noise conditions change across the spectrum.
The Sequential Probability Ratio Test (SPRT) is an advanced statistical method developed originally for radar systems that makes decisions as evidence accumulates, rather than using a fixed number of samples.
SPRT Decision Process
SPRT continuously evaluates samples until sufficient evidence leads to a decision
Likelihood Ratio Evolution
As samples are collected, the likelihood ratio evolves until crossing a decision threshold
Key Advantages of Sequential Detection
Efficiency
Requires 20-50% fewer samples on average than fixed-sample methods to reach decisions
Quantifiable Performance
Directly controls both false alarm rate (α) and detection probability (1-β)
Confidence Metrics
Provides statistical confidence level for each detection
Weak Signal Detection
Can detect signals 2-3dB weaker than fixed threshold methods at same false alarm rate
Technical Implementation in Spot Scanner
The Sequential Detection implementation in Spot Scanner CFAR leverages statistical likelihood calculations to make optimal detection decisions. The algorithm:
- Estimates local noise floor using median filtering (more robust than mean)
- Calculates signal-to-noise ratio for each potential detection
- Applies Sequential Probability Ratio Test based on user-defined false alarm and detection probabilities
- Provides confidence values for each detection using logistic mapping of likelihood ratios
- Implements sophisticated cooldown mechanisms to prevent duplicate detections
This approach offers more reliable detection with fewer false alarms, particularly for weak or fluctuating signals in challenging RF environments with varying noise levels.
Revolutionary Signal Detection: The SPRT & CFAR Advantage
Spot Scanner CFAR brings together two powerful detection technologies in a groundbreaking combination that delivers unmatched performance in challenging RF environments.
The Perfect Partnership
While traditional CFAR excels at spatial analysis (examining cells across frequency), Sequential Detection masters temporal analysis (examining signals over time). Together, they form a detection system greater than the sum of its parts:
- CFAR provides the adaptive noise floor estimation across the spectrum
- Sequential Detection (SPRT) applies rigorous statistical testing to make the final determination
- This combination dramatically reduces both false alarms and missed detections
Real-World Advantage
This dual-technology approach delivers exceptional results in situations where other detection methods fail:
- Detect signals up to 3dB weaker than with standard methods
- Maintain reliable detection even when noise levels fluctuate dramatically
- Receive confidence metrics with each detection for improved decision-making
- Experience up to 50% faster detection of signals through optimized sampling
Exclusive to Spot Scanner CFAR: Our proprietary implementation combines the mathematical rigor of Sequential Detection with the real-world adaptability of CFAR algorithms, delivering a detection capability previously available only in military-grade radar systems.
Key Features
Advanced Signal Detection
- Multiple Detection Methods: Choose between Fixed Threshold, CA-CFAR, and OS-CFAR detection
- Adaptive Thresholding: Automatically adjusts detection thresholds based on local noise environment
- SNR Measurement: Calculates and displays signal-to-noise ratio for detected signals
- Frequency Estimation: Precision frequency estimation using quadratic interpolation
- Edge Detection Awareness: Special handling for signals detected at spectrum edges
CFAR Configuration
- Guard Cells: Adjustable guard cell count to exclude signal contamination
- Reference Cells: Configurable reference cell count for noise estimation
- Scale Factor: Fine-tune detection sensitivity with adjustable scale factor
- Minimum SNR: Set SNR threshold to reject weak signal detections
- Cooldown Timer: Prevent signal flooding with adjustable detection cooldown
Detection Parameter Tuning Guide
CFAR Detection Parameters
Guard Cells
- What it does: Defines how many cells on each side of the target cell are ignored to prevent signal contamination.
- Recommended ranges:
- Low: 1-2 (For very narrow signals, better frequency accuracy)
- Medium: 3-4 (Best general-purpose setting)
- High: 5-8 (For wide signals in clean environments)
- When to adjust: Increase when detecting wide-bandwidth signals; decrease for better frequency resolution with narrow signals.
Reference Cells
- What it does: Sets how many cells on each side are used to calculate the noise floor.
- Recommended ranges:
- Low: 4-8 (In rapidly changing noise environments)
- Medium: 8-16 (Best general-purpose setting)
- High: 16-32 (In stable noise environments for better averaging)
- When to adjust: More reference cells provide better noise floor estimation but may miss signals in rapidly changing environments. Use fewer cells when the noise floor varies significantly across the spectrum.
Scale Factor
- What it does: Multiplies the estimated noise floor to set the detection threshold.
- Recommended ranges:
- Low: 3.0-4.0 (More sensitive, may cause false alarms)
- Medium: 4.0-6.0 (Balanced performance)
- High: 6.0-10.0 (More conservative, fewer false alarms)
- When to adjust: Lower for detecting weak signals in stable environments; raise to reduce false alarms in noisy conditions.
Min SNR (dB)
- What it does: Sets a minimum Signal-to-Noise Ratio requirement for detection.
- Recommended ranges:
- Low: 3-9 dB (Very sensitive, may cause false alarms)
- Medium: 10-15 dB (Balanced performance)
- High: 16-30 dB (Detects only strong signals)
- When to adjust: Lower for detecting weak signals; raise to ensure only strong signals are detected.
Sequential Detection Parameters
False Alarm Rate (10^x)
- What it does: Sets the target probability of false alarms (entered as a power of 10).
- Recommended ranges:
- More Sensitive: -1 to -3 (10^-1 to 10^-3, faster response time)
- Balanced: -4 to -6 (10^-4 to 10^-6, general purpose)
- More Conservative: -7 to -12 (10^-7 to 10^-12, very few false alarms)
- When to adjust: For remote controls or intermittent signals, use -1 to -3 for faster detection. For long-term monitoring with few false alarms, use -6 or lower.
Detection Probability
- What it does: Sets the target probability of detection.
- Recommended ranges:
- Faster: 0.8-0.9 (Makes decisions more quickly but may miss signals)
- Balanced: 0.9-0.95 (Good general purpose)
- More Reliable: 0.95-0.999 (Higher confidence, but requires more samples)
- When to adjust: Lower for faster detection response; raise for higher detection confidence.
Scenario-Based Recommendations
Remote Control Detection
- Detection Method: Sequential Detection
- False Alarm Rate: -1 (0.1)
- Detection Probability: 0.9
- Min SNR: 3-5 dB
- Cooldown: 500 ms
Noisy Urban Environment
- Detection Method: OS-CFAR
- Guard Cells: 3
- Reference Cells: 16
- Scale Factor: 7.0
- Min SNR: 15-20 dB
Weak Signal Hunting
- Detection Method: Sequential Detection
- False Alarm Rate: -3 (0.001)
- Detection Probability: 0.99
- Min SNR: 3 dB
- Cooldown: 3000 ms
Clean Rural Environment
- Detection Method: CA-CFAR
- Guard Cells: 2
- Reference Cells: 8
- Scale Factor: 4.0
- Min SNR: 10 dB
Strong Signal Monitoring
- Detection Method: Fixed Threshold or CA-CFAR
- Scale Factor: 8.0
- Min SNR: 25 dB
Troubleshooting Common Issues
Too Many False Detections
- For CFAR detection:
- Increase Scale Factor
- Increase Min SNR
- Increase Reference Cells for better noise estimation
- For Sequential Detection:
- Decrease False Alarm Rate (use a more negative exponent)
- Increase Detection Probability
- Increase Min SNR
Missing Valid Signals
- For CFAR detection:
- Decrease Scale Factor
- Decrease Min SNR
- Adjust Guard Cells to match signal width
- For Sequential Detection:
- Increase False Alarm Rate (use a less negative exponent)
- Decrease Detection Probability
- Decrease Min SNR
Detection is Too Slow
- For CFAR detection:
- Decrease Reference Cells
- Decrease Guard Cells
- For Sequential Detection:
- Increase False Alarm Rate (use -1 or -2)
- Decrease Detection Probability (try 0.9 or 0.8)
- Decrease Cooldown time
Frequency is Not Accurately Reported
- For CFAR detection:
- Decrease Guard Cells for better frequency resolution
- Ensure Reference Cells aren't too low
- For any detection method:
- Make sure the signal is strong enough
- Check if the signal is at the edge of the viewing window
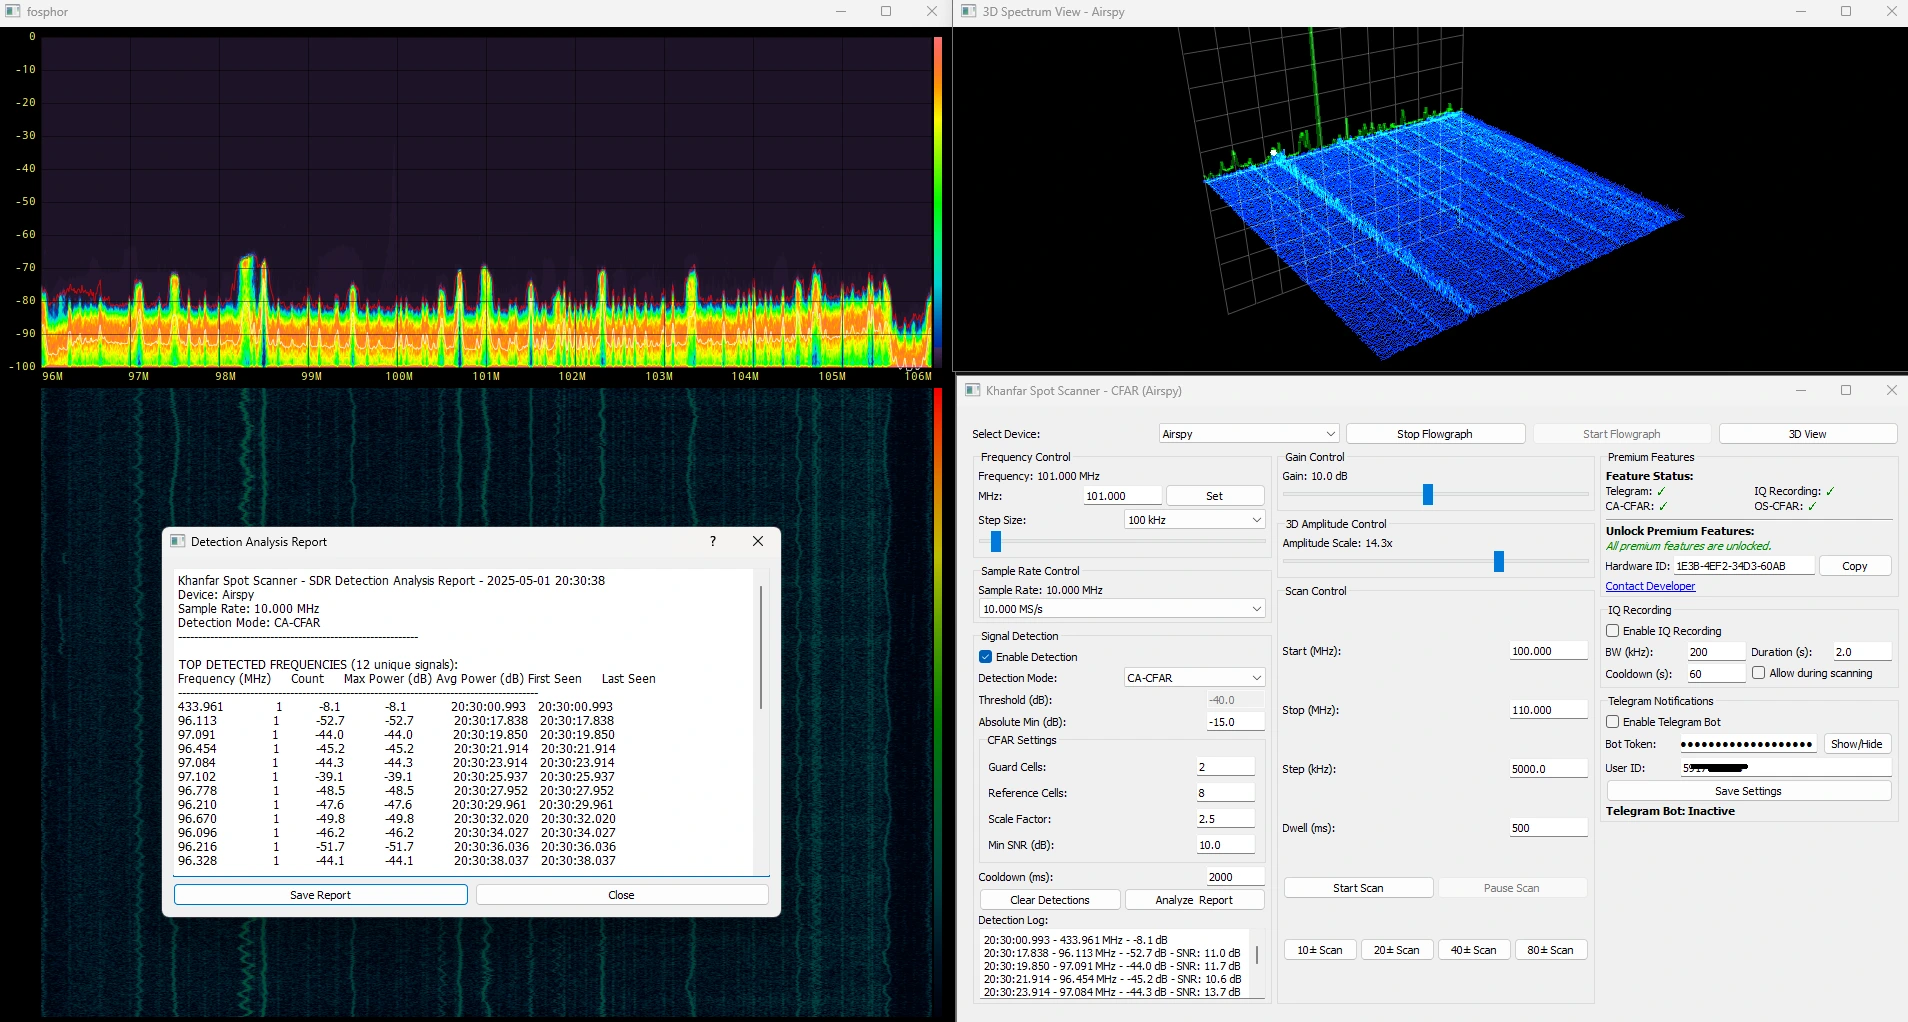
Detection Reporting
- Real-time Detection Log: Captures frequency, power, and SNR of detected signals
- Statistical Analysis: Generate comprehensive reports with detailed signal statistics
- Frequency Distribution: Visualize detection patterns across frequency bands
- Signal Strength Analysis: Categorize signals by power levels
- SNR Distribution: Track and analyze signal quality metrics
Advanced Visualization
- 3D Spectrum Display: Immersive 3D visualization of the RF spectrum
- Real-time Detection Markers: Visual indicators for detected signals
- GPU-Accelerated Rendering: Smooth visualization with gr-fosphor
- Waterfall Display: Temporal view of signal activity
- Amplitude Scaling: Adjustable 3D amplitude scale for optimal visualization
Multi-Device Support
- RTL-SDR Compatibility: Works with all RTL-SDR devices
- Airspy Support: Compatible with Airspy devices
- HackRF Integration: Full support for HackRF hardware
- Auto-Detection: Automatic discovery of connected SDR devices
- Dynamic Switching: Switch between devices without restarting
Scanning Capabilities
- Frequency Scanning: Automated scanning across specified frequency ranges
- Preset Scans: Quick-launch frequency scans (10±, 20±, 40±, 80± MHz)
- Adjustable Parameters: Configurable step size and dwell time
- Pause/Resume: Control over scanning process
Premium Plugins
Enhance your signal detection capabilities with our premium plugins, each providing specialized functionality for advanced users.
IQ RECORDING (PREMIUM FEATURE)
Record raw I/Q data of detected signals for advanced offline analysis.
Recording Features:
- Configurable parameters: Recording bandwidth, cooldown period, and duration
- Automatic file naming: Organized with frequency and timestamp
- Comprehensive metadata: Detailed signal information stored with each recording
File Information:
- Universal format: Compatible with common IQ data analysis tools
- Storage location: Files are saved in your Documents directory
Analysis Tip: Use the IQ Analyzer web app to analyze your recorded IQ files without additional software.
TELEGRAM INTEGRATION (PREMIUM FEATURE)
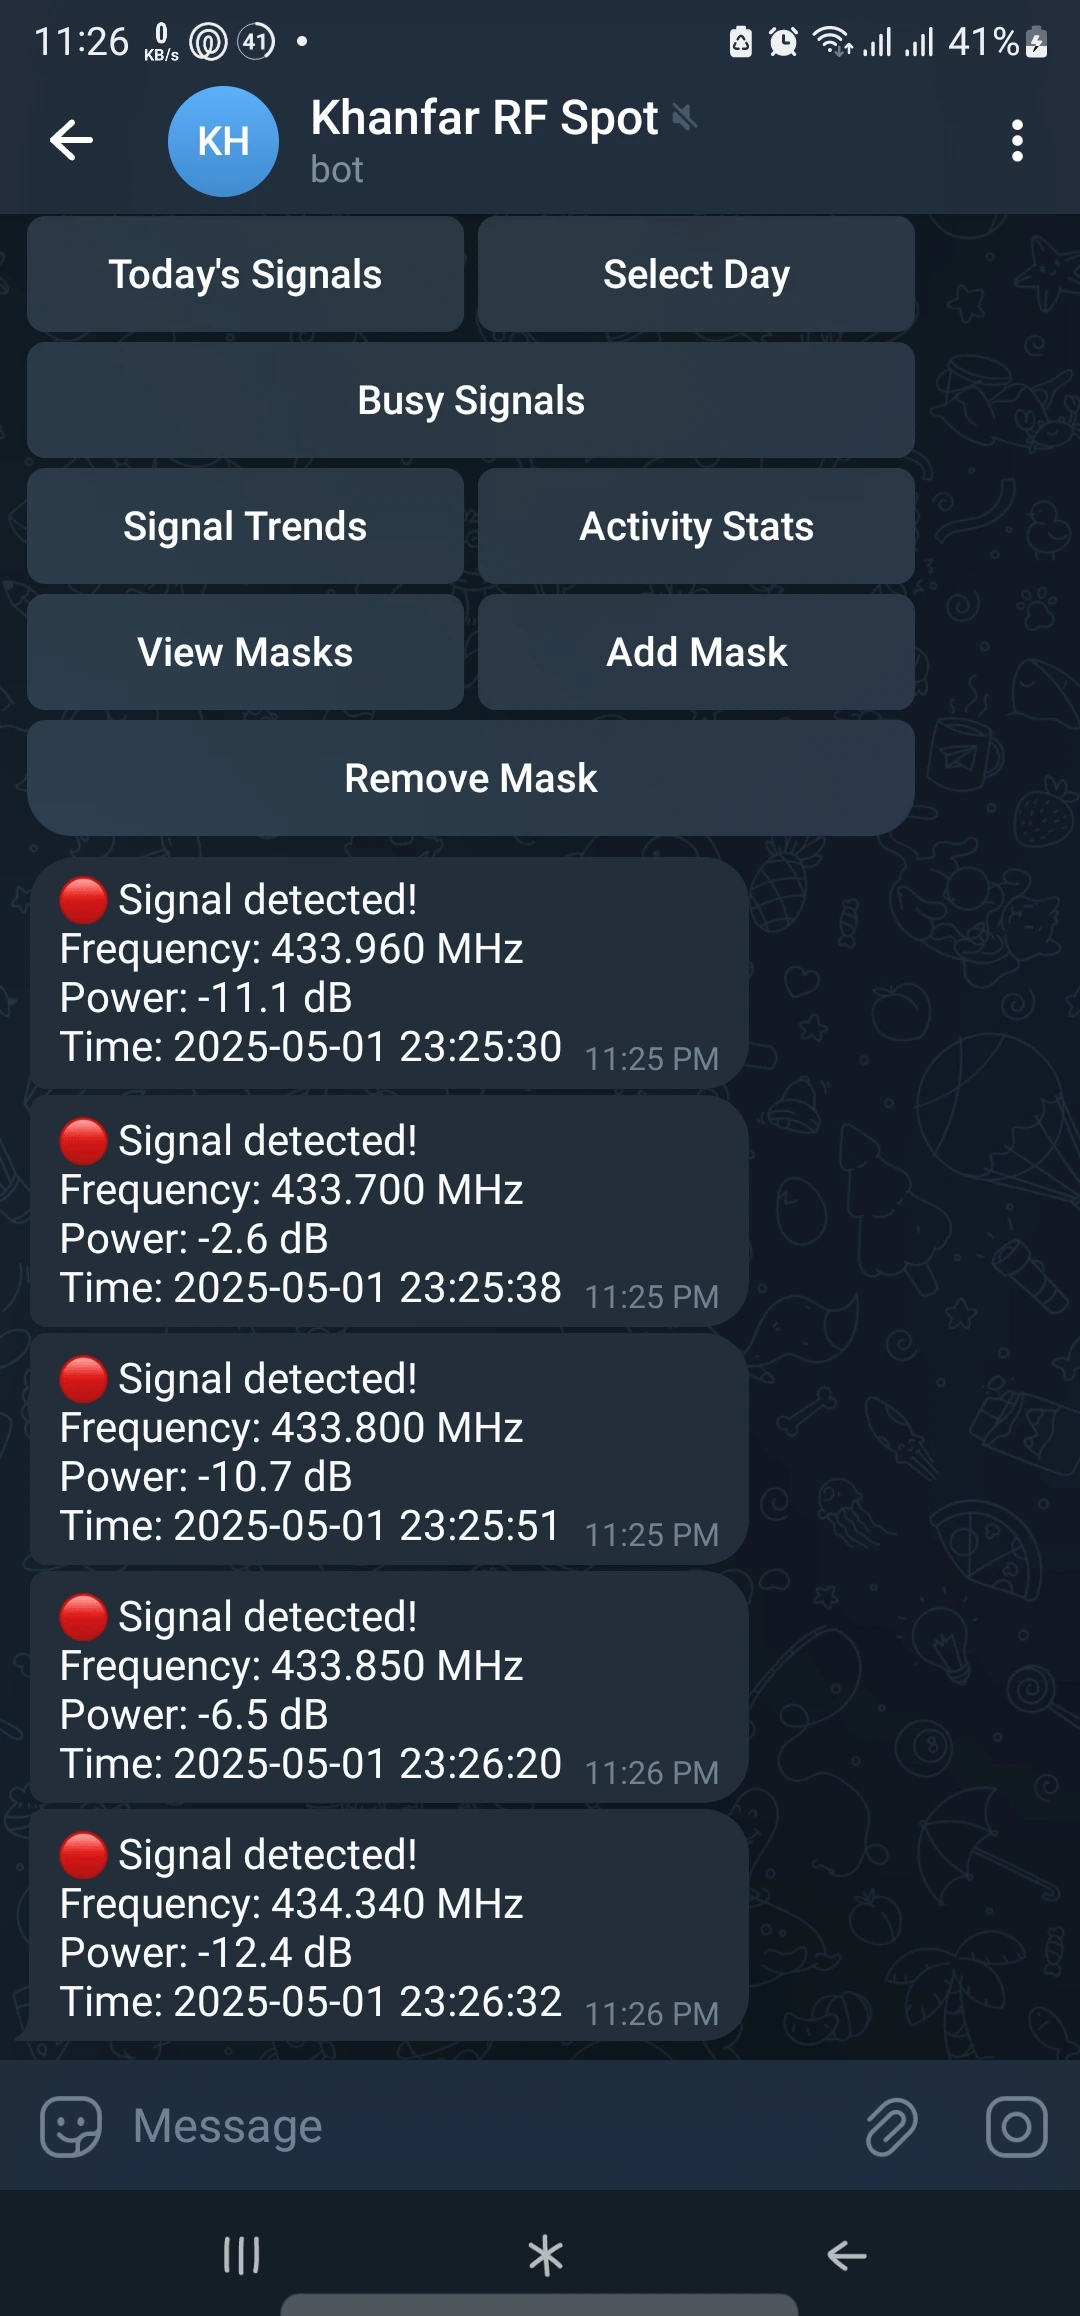
Receive real-time notifications of signal detections via Telegram for comprehensive remote monitoring and control of your signal environment.
Basic Features:
- Real-time signal alerts: Instant notifications with frequency, power, SNR, and timestamp
- Selective monitoring: Toggle between Live Mode for instant alerts and Silent Mode for quiet logging
- Multiple recipients: Configure multiple authorized users for notification access
- Secure integration: Private bot token and user authorization system
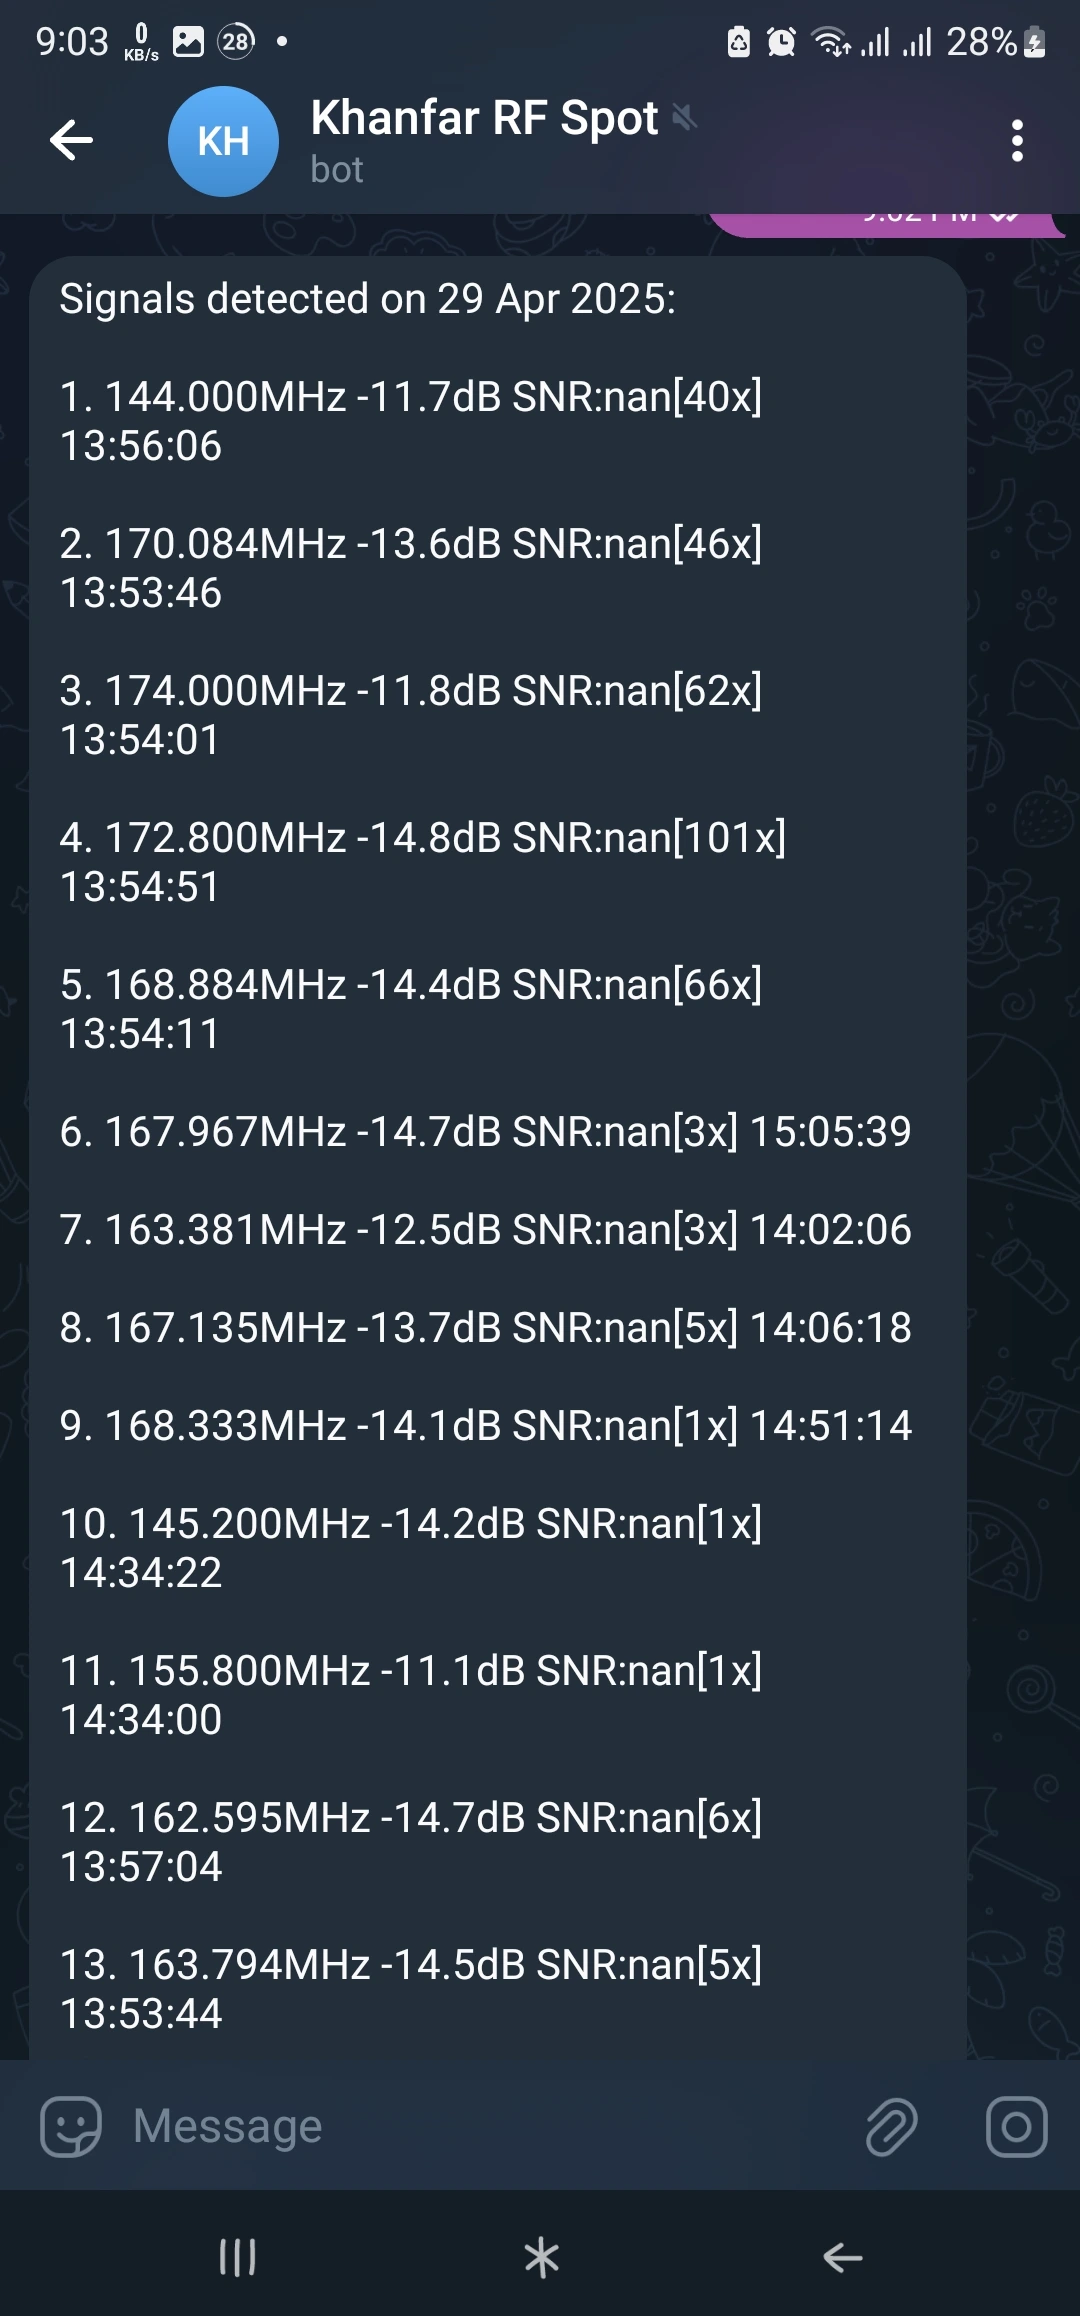
Signal History Management:
- Complete signal history: Access all previously detected signals
- Time-based filtering: View signals from last hour, last 10 minutes, or any specific date
- Calendar browsing: Select any day from historical data (up to 14 days)
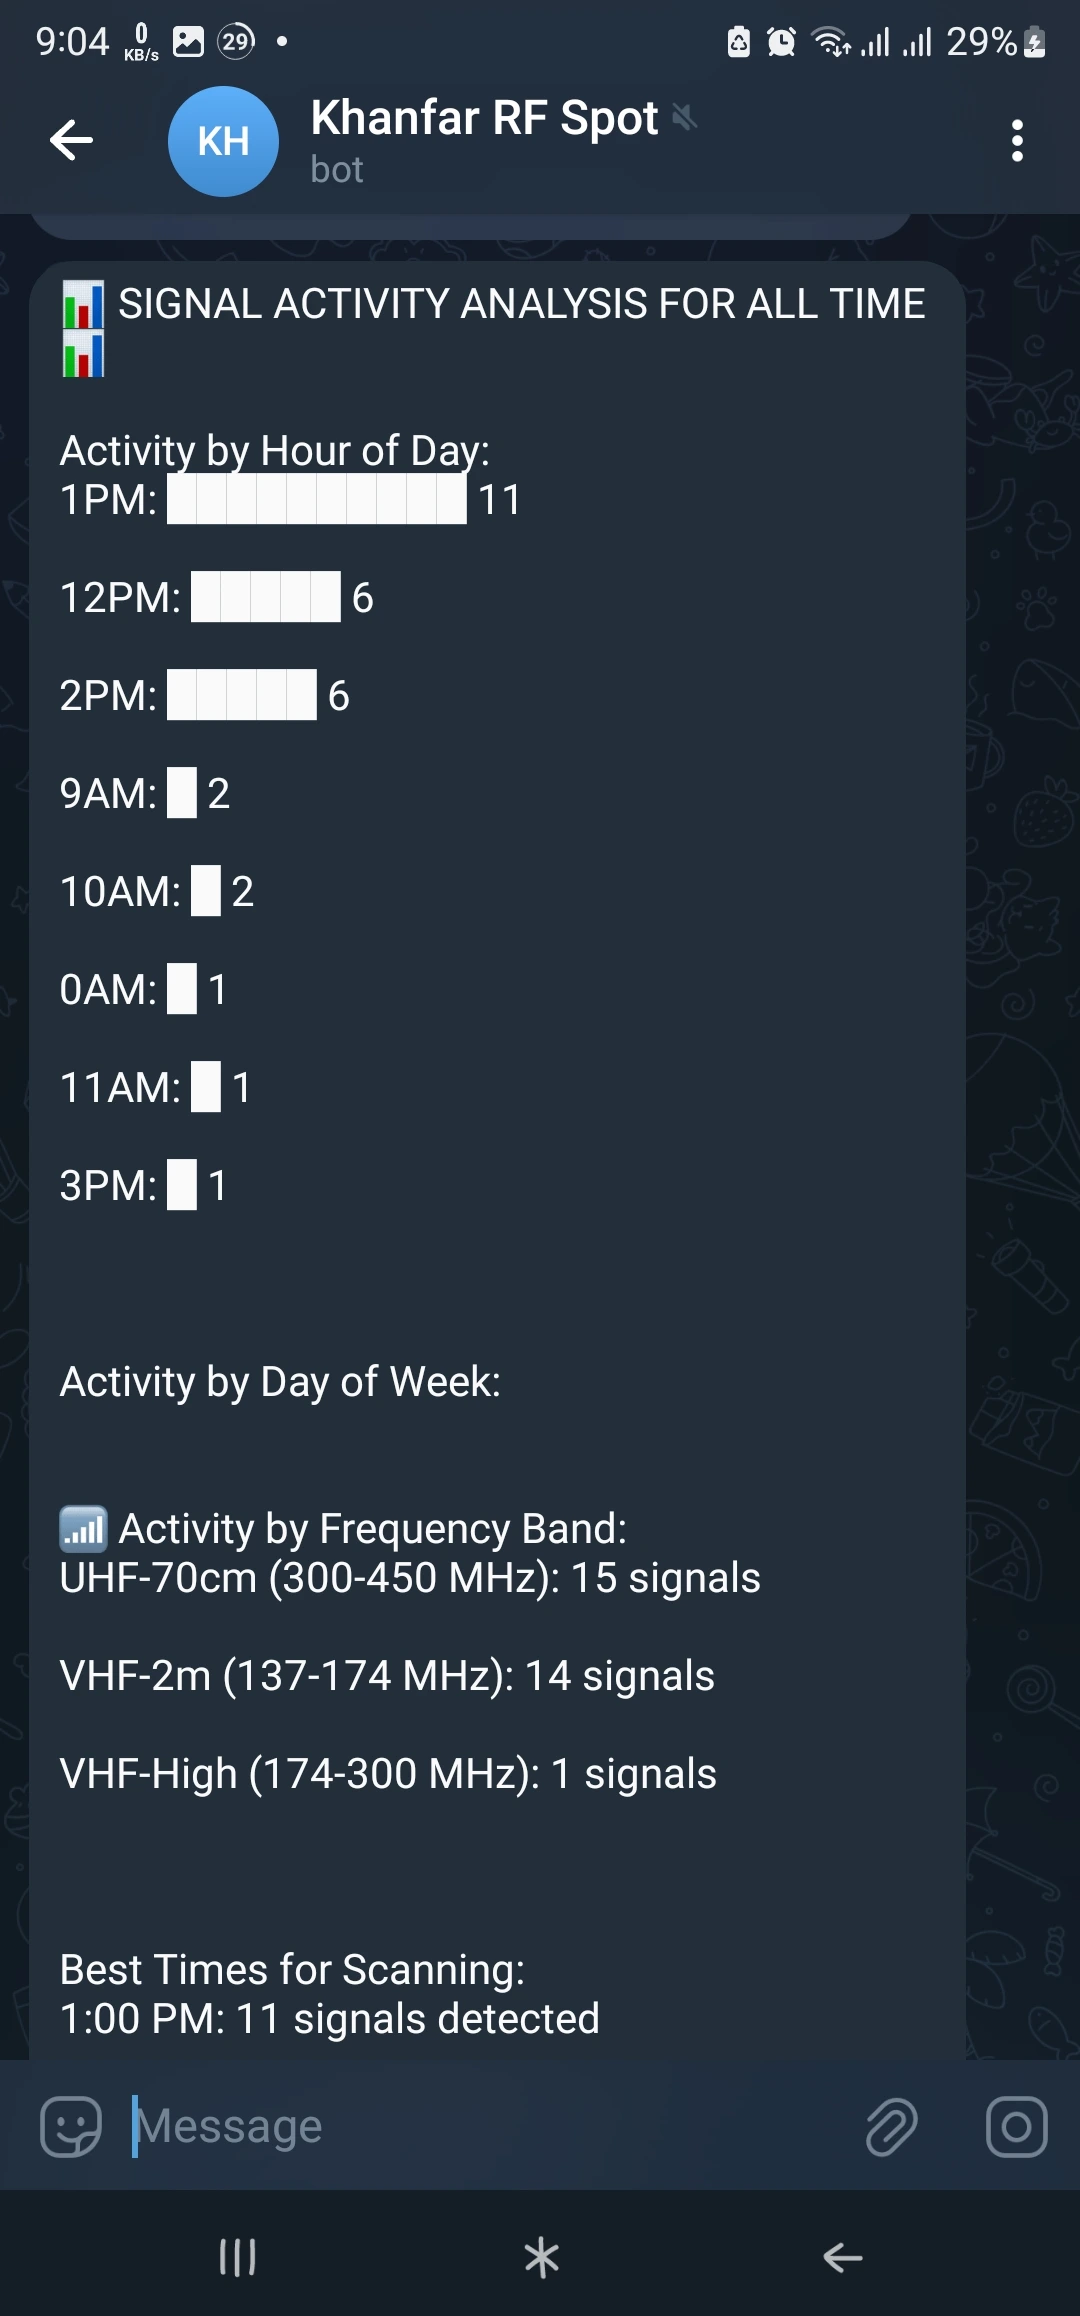
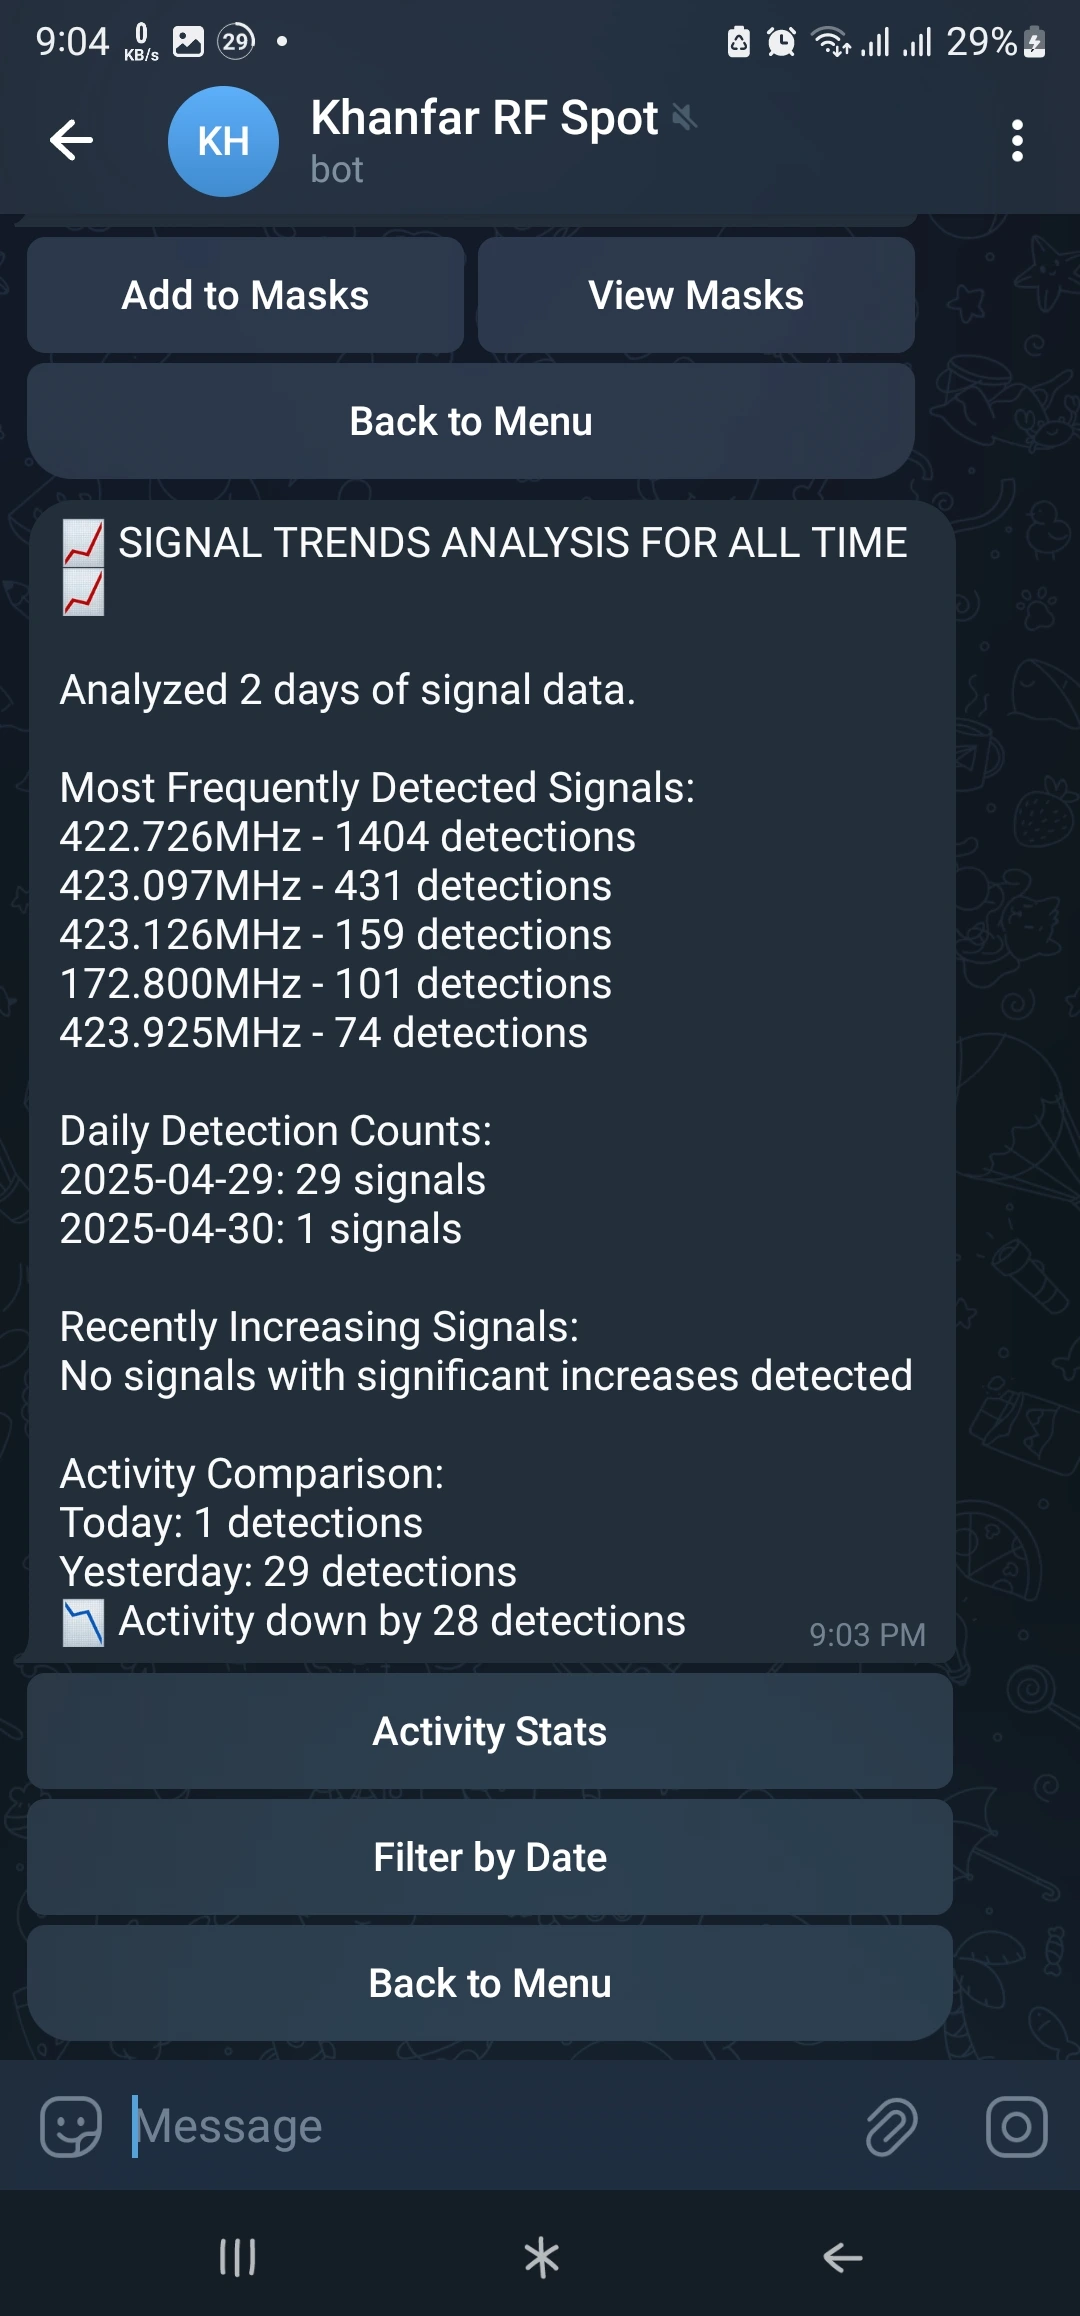
Advanced Analytics:
- Signal trends analysis: Track detection patterns over time
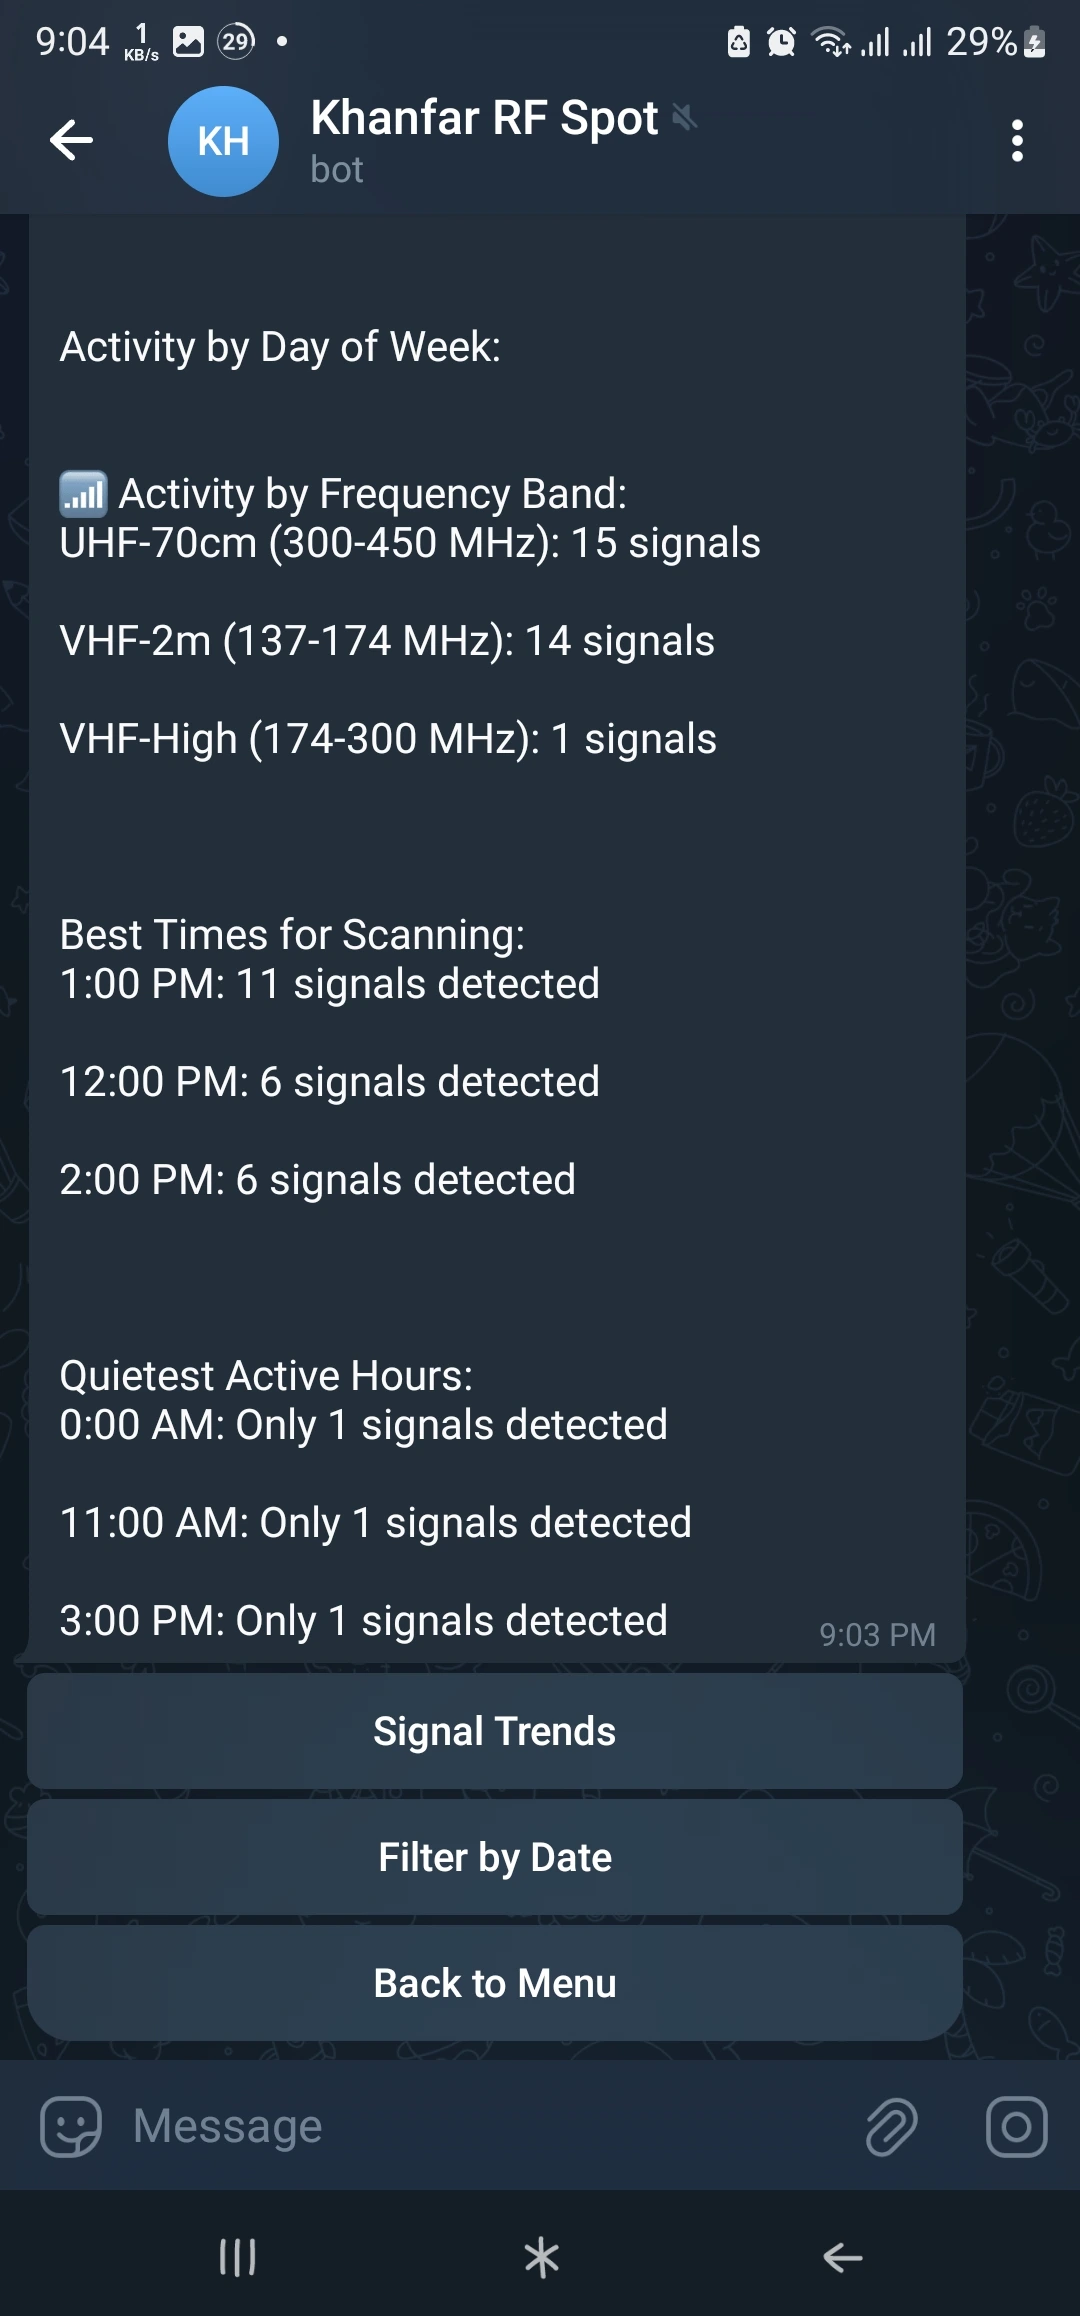
- Hourly activity stats: Visualize peak detection hours
- Frequency band analysis: See which parts of the spectrum are most active
Frequency Management:
- Busy signal identification: Automatically detect frequencies with multiple appearances
- Ignore mask system: Create exclusions for known frequencies to reduce false alerts
- One-click masking: Easily add busy signals to your ignore list
Usage Tip: Configure Telegram's notification settings on your mobile device to ensure you never miss critical signal detections.
ADVANCED RADAR DETECTION ALGORITHMS
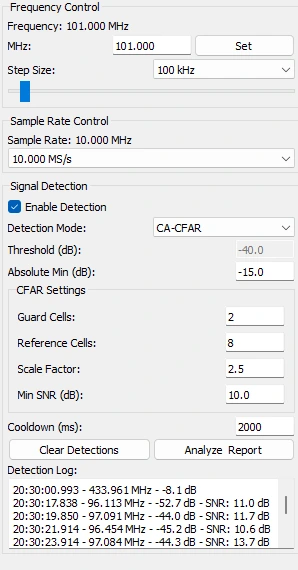
CA-CFAR (Cell Averaging CFAR)
Advanced adaptive threshold algorithm based on surrounding noise levels.
Key Capabilities:
- Improved detection in varying noise environments
- Adjustable parameters: Guard cells, reference cells, scaling factor
- Reduced false positives compared to fixed threshold
- Compatible with all modes: Works in standard and 3D visualization
Usage Tip: CA-CFAR works best in environments with relatively uniform noise distribution across the spectrum.
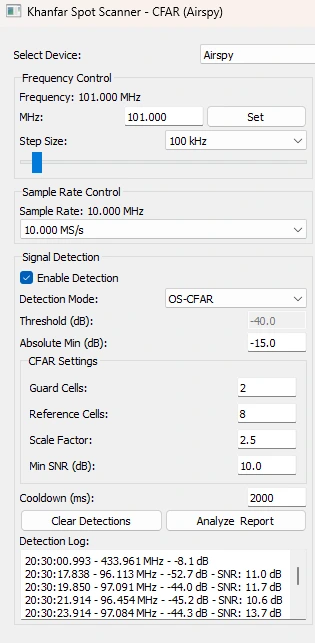
OS-CFAR (Ordered Statistics CFAR)
Superior detection algorithm for challenging RF environments with multiple signals.
Key Capabilities:
- Superior performance in multiple signal environments
- Enhanced immunity to adjacent signals and interference
- Robust detection in challenging RF environments
- Customizable parameters: Adjustable percentile parameter
Usage Tip: OS-CFAR is ideal for crowded spectrum monitoring where multiple signals may be present simultaneously.
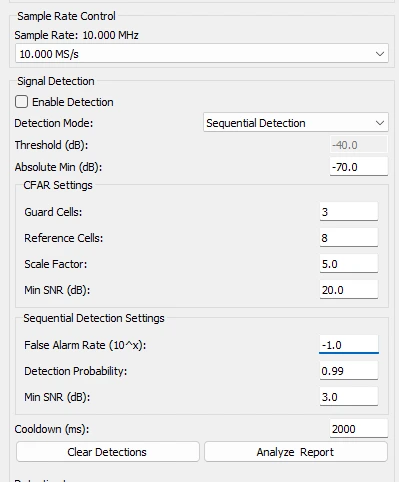
Sequential Detection (SPRT)
Advanced radar-derived algorithm that dynamically determines optimal sample size for reliable signal detection.
Key Capabilities:
- Superior sensitivity: 2-3dB better detection than CFAR at same false alarm rate
- Probabilistic control: Directly specify desired false alarm and detection probabilities
- Adaptive sampling: Uses fewer samples for obvious cases, more for ambiguous signals
- Confidence metrics: Provides statistical confidence level for each detection
Usage Tip: Sequential Detection excels at identifying weak signals that fluctuate in strength, making it ideal for detecting elusive or intermittent transmissions.
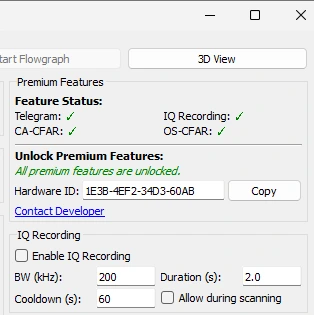
ACTIVATING PREMIUM FEATURES
The base software is fully functional with a fixed detection threshold without requiring any plugins. For advanced features, each premium plugin can be activated individually based on your specific needs.
Plugin Pricing:
- IQ Recording Plugin: $15
- Telegram Integration: $30
- CA-CFAR Algorithm: $20
- OS-CFAR Algorithm: $20
- Sequential Detection: $25
To activate a premium feature:
- Download and install the software, which is fully functional with basic features
- To activate premium plugins, click on the desired plugin in the application
- Copy your unique Hardware ID shown in the license activation window
- Contact the developer at E4MWAK@GMAIL.COM with your Hardware ID
- The developer will send you a PayPal payment link
- After payment confirmation, you'll receive an unlock code for your selected plugin
- Enter the unlock code in the license activation window
- The premium feature will be immediately activated and tied to your hardware
IQ RECORDING USAGE
The IQ recording feature captures raw I/Q data whenever a signal is detected above your threshold settings. These recordings can be used for in-depth signal analysis in specialized software.
To use the IQ recording feature:
- Activate the IQ Recording feature with a valid license
- In the IQ Recording section of the control panel:
- Check the "Enable IQ Recording" box
- Set desired bandwidth in kHz
- Set cooldown period (minimum time between recordings of the same frequency)
- Set recording duration in seconds
- Optionally enable "Allow during scanning"
- When signals are detected, IQ files will be automatically created
- Access recordings in the configured recording directory
- Use SDR# or other RF analysis software to open the .iq files
The IQ files are stored in an interleaved 32-bit float format that is compatible with most SDR analysis software. Each recording includes a companion .txt metadata file with detailed signal parameters.
Important Note: Be aware of IQ recording limitations while scanning. You need to adjust scanning speed based on the capacity of the IQ data you want to capture. Faster scanning may result in missed IQ recordings for brief signals.
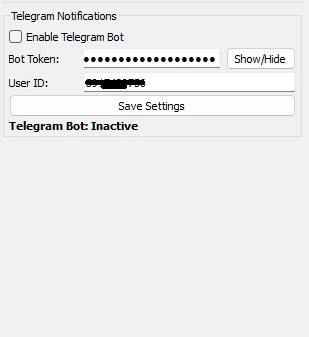
TELEGRAM INTEGRATION USAGE
The Telegram integration provides a powerful remote monitoring and analysis system for signal detections.
To set up Telegram integration:
- Activate the Telegram feature with a valid license
- Create a Telegram bot:
- Open Telegram and search for @BotFather
- Use the /newbot command and follow the instructions
- Save the API token provided by BotFather
- Configure Telegram settings in the application:
- Enter your Bot Token in the configuration field
- Add your Telegram user ID(s) to the authorized users list
- Set minimum signal strength threshold (in dB)
- Configure cooldown period between notifications
- Save the configuration and toggle the Telegram bot on
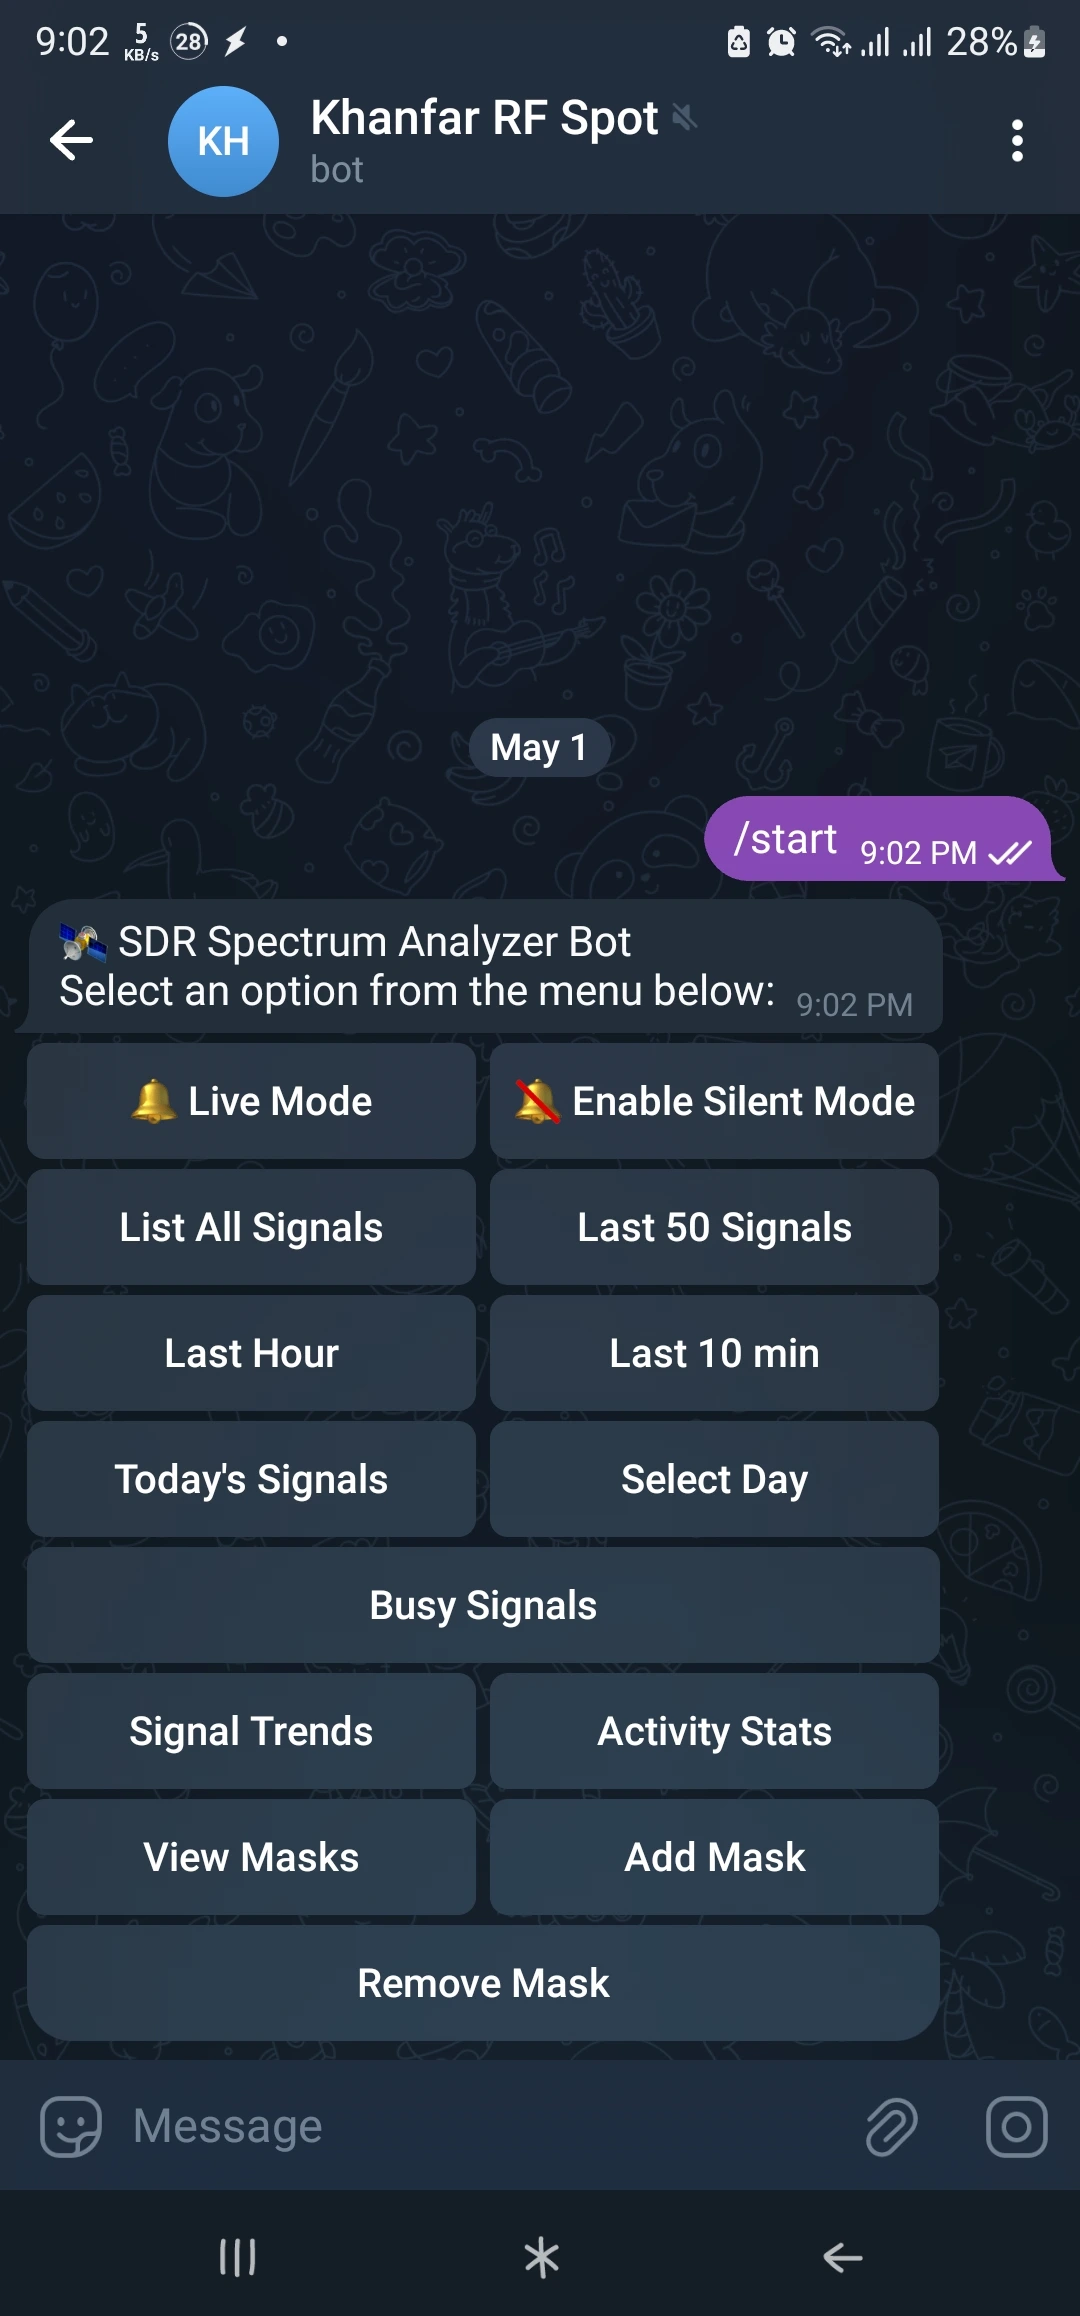
- Start the bot by sending /start to your bot in Telegram
Important Note: You need to manually start the Telegram bot from the software GUI after each new run by clicking the "Enable Telegram Bot" option.
Key Commands and Features:
- /start or /menu: Access the main control menu
- Live/Silent Mode: Toggle between receiving real-time alerts or silent logging
- Signal History:
- View all signals or filtered lists (Last 50, Last Hour, Last 10 minutes)
- Browse by date using the calendar interface (up to 14 days of history)
- One-touch access to today's signals
- Analytics and Insights:
- View activity statistics by hour, day, and frequency band
- Track signal trends and identify patterns over time
- Filter analytics by specific dates
- Frequency Management:
- Identify busy/recurring signals with the 'Busy Signals' feature
- Add frequencies to ignore list to prevent false alerts
- Set custom tolerance ranges for each masked frequency
- View and remove masks as needed
Each signal notification includes precise frequency (MHz), signal power (dB), signal-to-noise ratio when available, and timestamp information. The bot stores all signal detections in a database for historical analysis.
ADVANCED CFAR DETECTION USAGE
The advanced CFAR detection algorithms provide significantly improved signal detection capabilities in various RF environments.
To use the advanced detection algorithms:
- Activate the desired CFAR algorithm (CA-CFAR or OS-CFAR) with a valid license
- In the Detection Mode dropdown, select the activated CFAR algorithm
- Adjust the CFAR parameters:
- Reference cells: Number of cells used to estimate noise level
- Guard cells: Number of cells skipped to avoid signal leakage
- Scaling factor: Adjusts the detection sensitivity
- The software will now use the selected algorithm for all signal detection
Each CFAR algorithm has unique strengths:
- CA-CFAR: Better for environments with uniform noise
- OS-CFAR: Superior in environments with multiple signals or interference
Implementation Details
CFAR Implementation
The CFAR implementation in Khanfar Spot Scanner features a sophisticated approach to adaptive threshold signal detection:
Key Components
- CFARDetector Class: Core implementation of CFAR algorithms with customizable parameters
- Guard Cells: Cells immediately surrounding the cell under test that are excluded from noise calculation to prevent signal contamination
- Reference Cells: Cells used to estimate the local noise level
- Scale Factor: Multiplier applied to the estimated noise level to set the detection threshold
- Detection Processing: Sophisticated signal processing with quadratic interpolation for frequency precision
- 3D View Integration: Real-time visualization of detected signals in the 3D spectrum view
- Detection Log: Comprehensive tracking of all detected signals with frequency, power, and SNR metrics
| Detection Method | Advantages | Ideal Use Cases |
|---|---|---|
| Fixed Fixed Threshold |
|
|
| CA-CFAR Cell-Averaging CFAR |
|
|
| OS-CFAR Ordered-Statistic CFAR |
|
|
| SPRT Sequential Probability Ratio Test |
|
|
CFAR Processing Workflow
- Signal Acquisition: RF samples are collected from the SDR device
- FFT Processing: Samples are transformed to the frequency domain
- Noise Estimation: Local noise level is calculated using surrounding cells (excluding guard cells)
- Threshold Calculation: Adaptive threshold is computed by applying the scale factor to estimated noise
- Peak Detection: Signal peaks exceeding the threshold are identified
- SNR Calculation: Signal-to-noise ratio is calculated for each detection
- Frequency Refinement: Quadratic interpolation improves frequency precision
- Signal Reporting: Detections are logged with frequency, power, and SNR information
Usage Guide
Getting Started
- Launch the Application: Start the Khanfar Spot Scanner - CFAR Edition
- Select Device: Choose your SDR device from the dropdown menu
- Start Flowgraph: Click "Start Flowgraph" to begin signal processing
- Launch 3D View: Click "3D View" to open the 3D visualization (required for detection)
Important: Signal detection requires the 3D View to be active. You must launch the 3D visualization before enabling detection.
Configuring CFAR Detection
- Choose Detection Mode: Select between Fixed Threshold, CA-CFAR, or OS-CFAR
- Configure Settings:
- For Fixed Threshold: Set Threshold (dB) and Absolute Min (dB)
- For CFAR Modes: Configure Guard Cells, Reference Cells, Scale Factor, and Min SNR
- Set Cooldown: Adjust the detection cooldown period (ms) to prevent flooding
- Enable Detection: Check the "Enable Detection" box to activate signal detection
Tuning Example
| Parameter | Recommended Value | Notes |
|---|---|---|
| Guard Cells | 2-4 | Higher values for wider signals |
| Reference Cells | 8-16 | More cells for better noise estimation |
| Scale Factor | 2.5-4.0 | Higher values reduce false alarms but may miss weak signals |
| Min SNR | 6-10 dB | Minimum signal quality for detection |
| Cooldown | 1000-2000 ms | Prevents duplicate detection logging |
Analyzing Detections
- Monitor Detection Log: View real-time detections with frequency, power, and SNR information
- Generate Reports: Click "Analyze & Report" to create a comprehensive detection analysis
- Save Reports: Save analysis reports for documentation or further study
- Clear Detections: Use "Clear Detections" to reset the detection log when needed
Optimizing Detection Performance
- CA-CFAR for General Use: Best for typical scanning and monitoring
- OS-CFAR for Crowded Bands: Superior in frequency bands with multiple signals
- Reference Cell Balance: More cells improve noise estimation but reduce resolution near band edges
- Scale Factor Tuning: Start with 2.5 and adjust based on false alarm rate
- Guard Cell Adjustment: Match to expected signal bandwidth
Advanced Techniques
- Comparative Analysis: Run different detection methods on the same frequency range to compare effectiveness
- Band Scanning: Use preset scans with CFAR detection to rapidly survey large frequency ranges
- Edge Detection Enhancement: The software automatically enhances frequency precision for signals detected at spectrum edges
System Requirements
- Operating System: Windows 10/11
- CPU: Intel i5 9.5th generation or equivalent
- RAM: 16GB minimum
- GPU: NVIDIA GTX 1650 4GB or equivalent minimum
Support Our Development
If you find our software useful and want to support our continued development, please consider making a donation. Your support helps us maintain and improve these tools for the entire RF community.
Please Donate
Help with the considerable costs:
• Hardware lots and lots of it
• Software
• And then there's the pet food! There's a new Kitty here, her name is Lulu and she likes food and balls!


Crypto Donation Address
Send your support to:
0x0c2b233268bdd2777afa57bc3ba350191dddbb12
Every contribution, no matter how small, helps us continue developing professional tools for the RF community.