Our Software Solutions
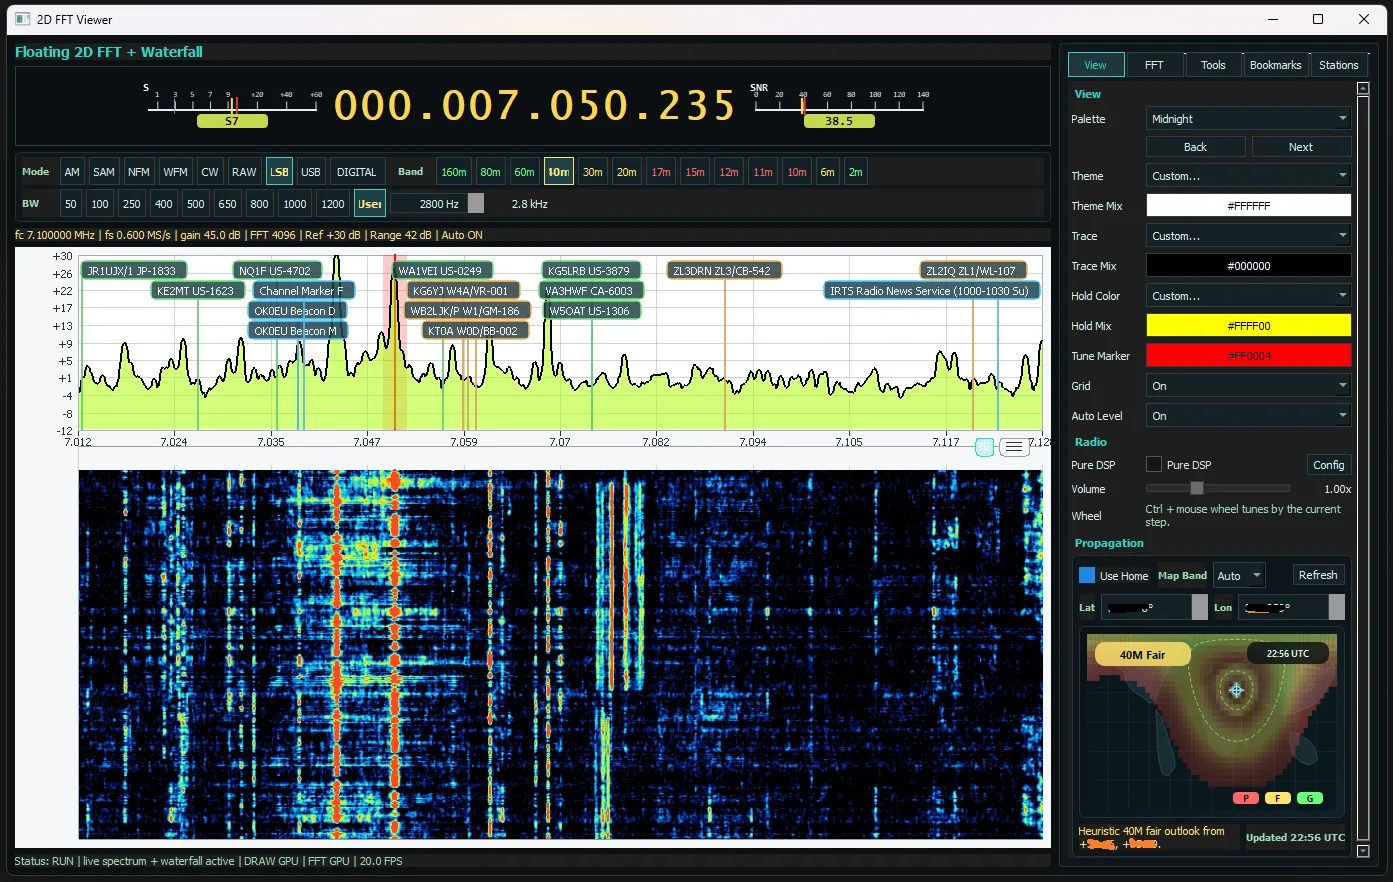
Khanfar RSA
Multi-SDR operations console with SWL and HF listening, 2.4/5 GHz Wi-Fi analysis, LTE Analysis, Pure DSP AM/SSB, analog ATV, hybrid DATV, upgraded ADS-B and AIS mapping, IQ WAV replay/record, and 3 Layers Gamma FFT across RTL-SDR, Airspy HF+, LimeSDR, SDRPlay, and more.
Open Page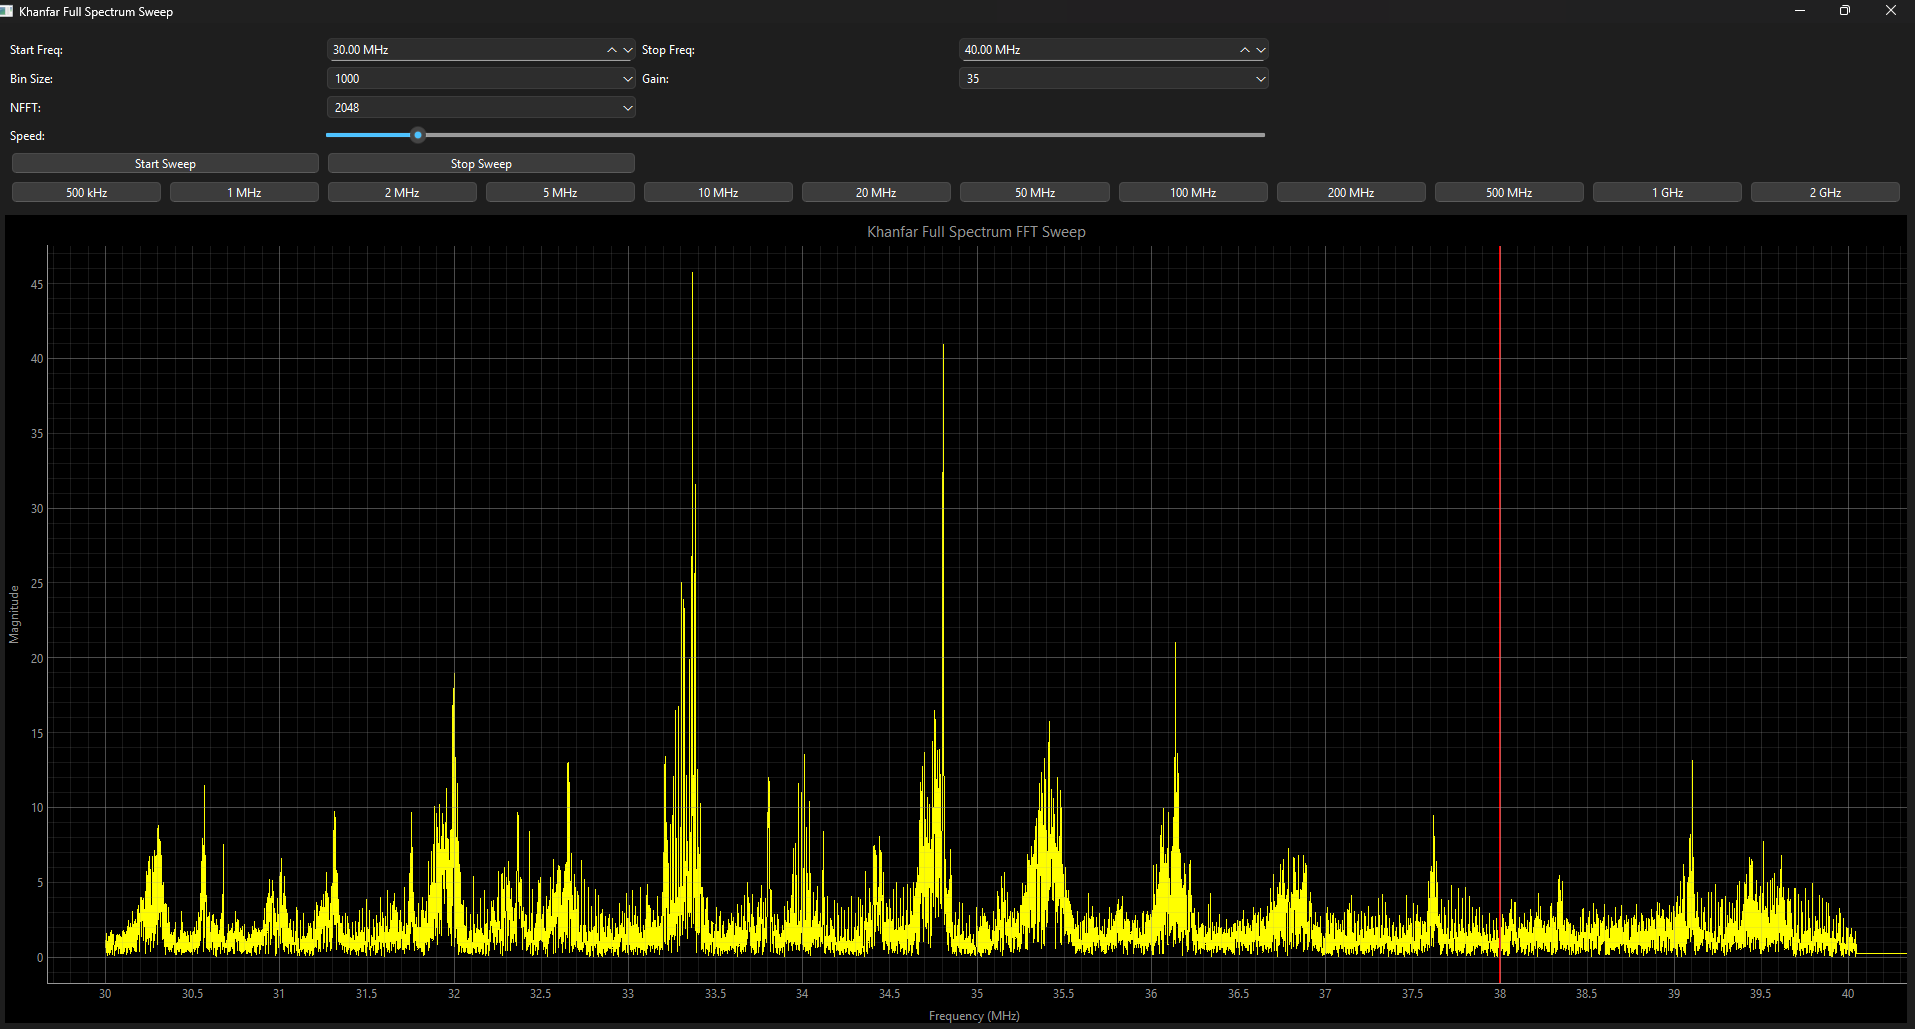
Khanfar RTL Sweeper
Fast RTL-SDR spectrum sweeper with real-time FFT analysis and adjustable sweep control.
Open Page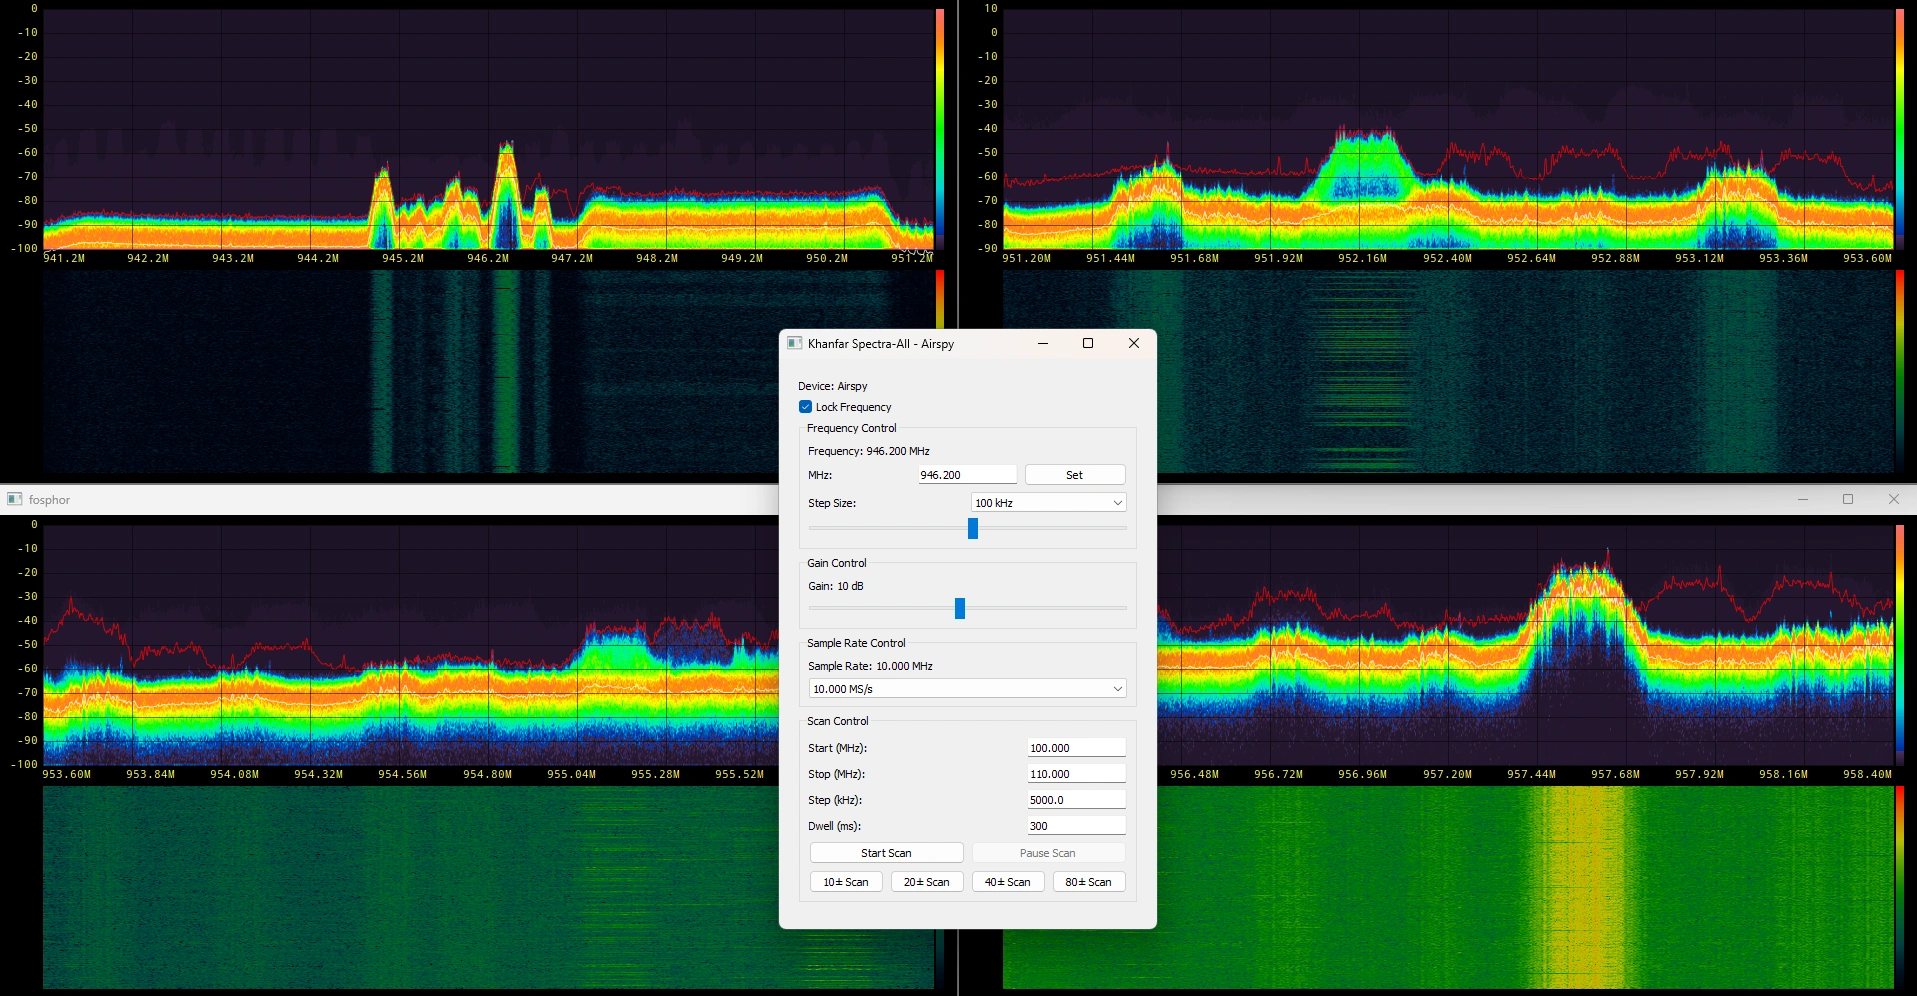
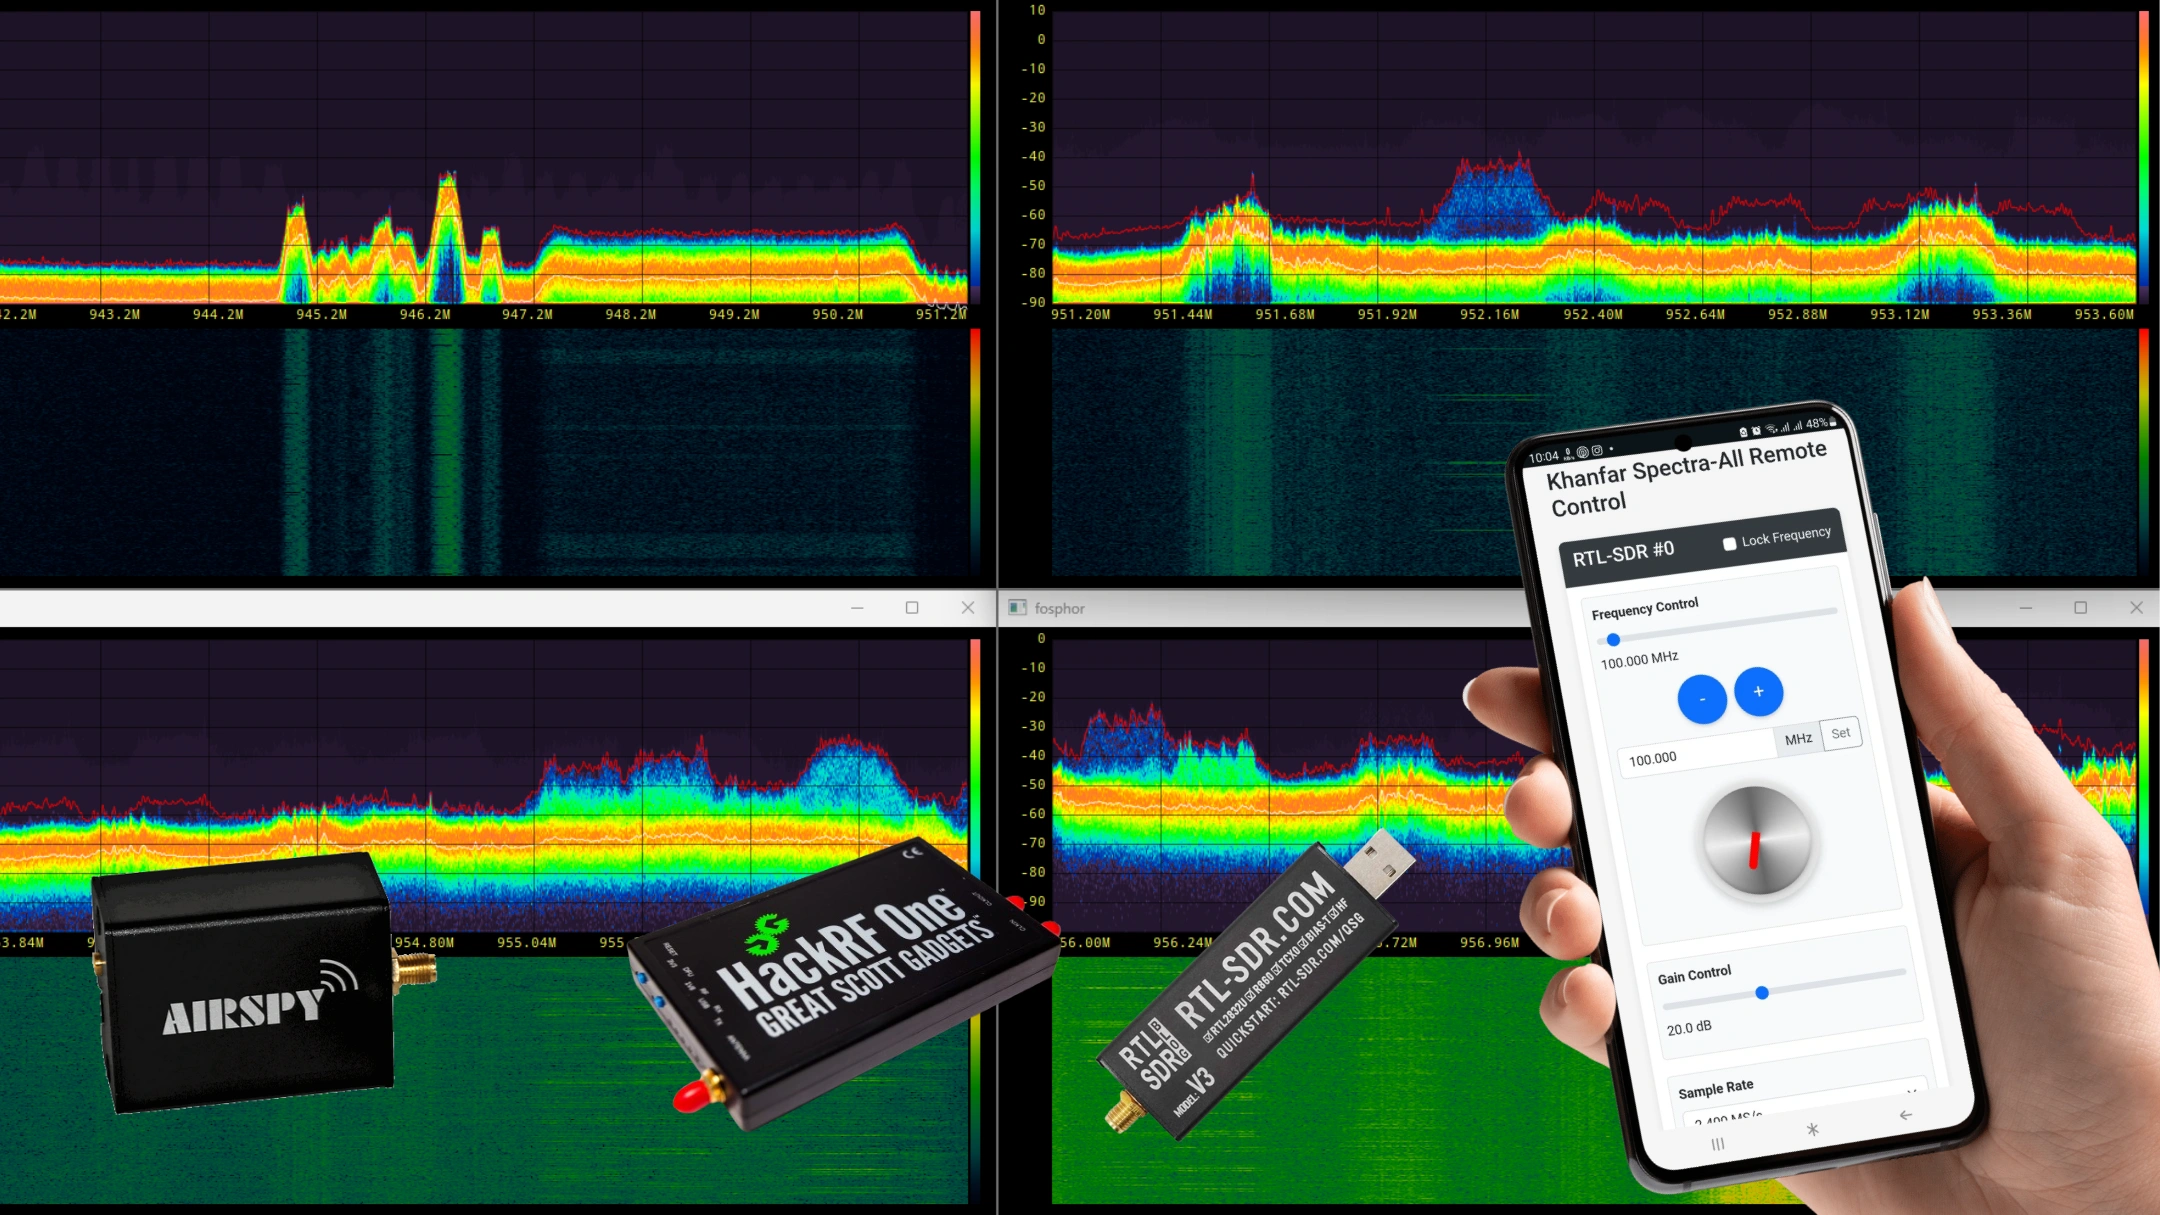
Khanfar Spectra-All v1.2
Latest update with LAN Command Controller and remote SDR control.
Open Page
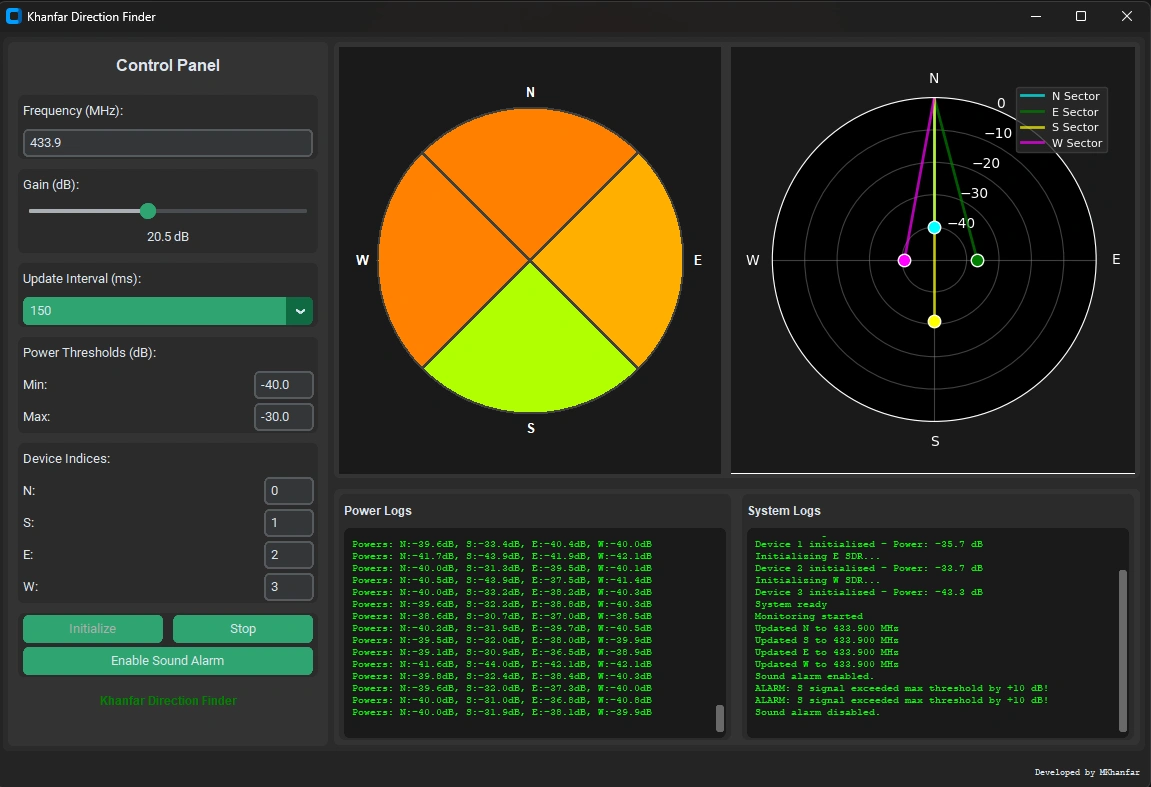
Khanfar Direction Finder
Multi-SDR direction finding suite with advanced visualization tools.
Open Page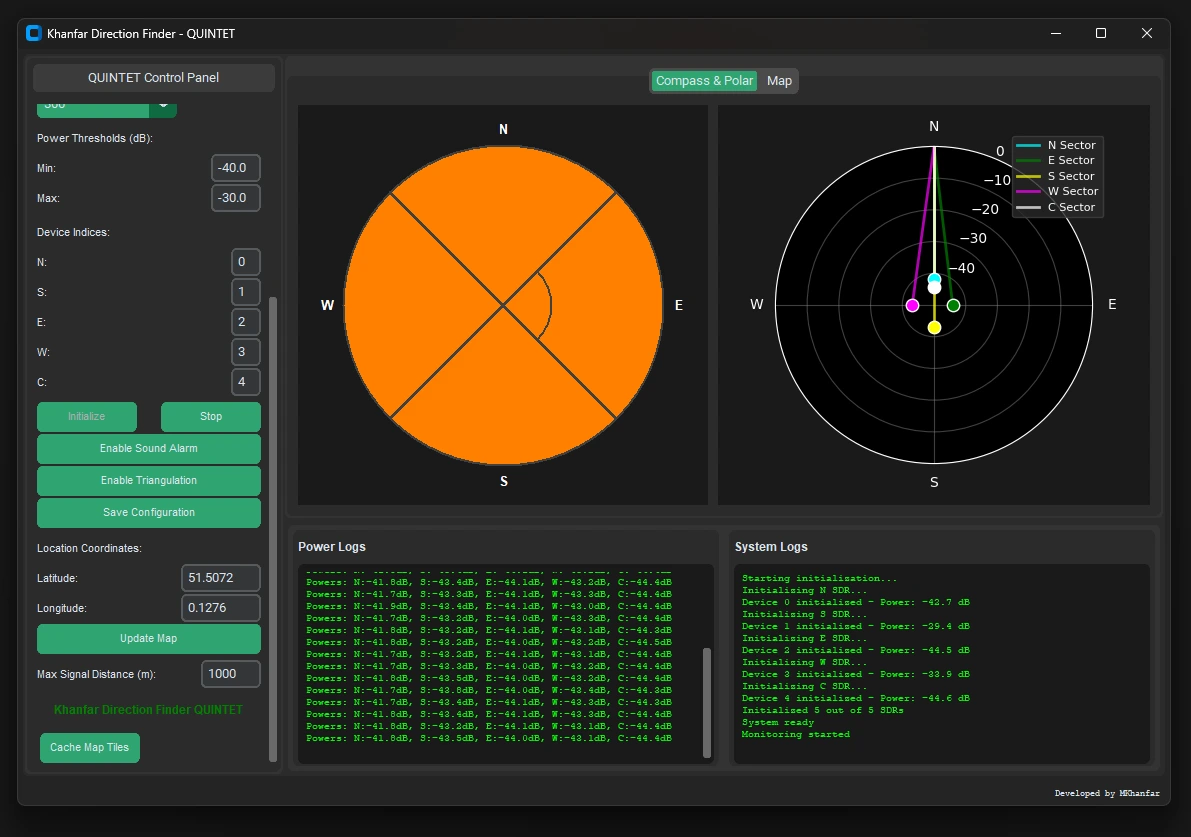
Khanfar Direction Finder QUINTET
Enhanced QUINTET DF system with a fifth SDR for improved triangulation.
Open Page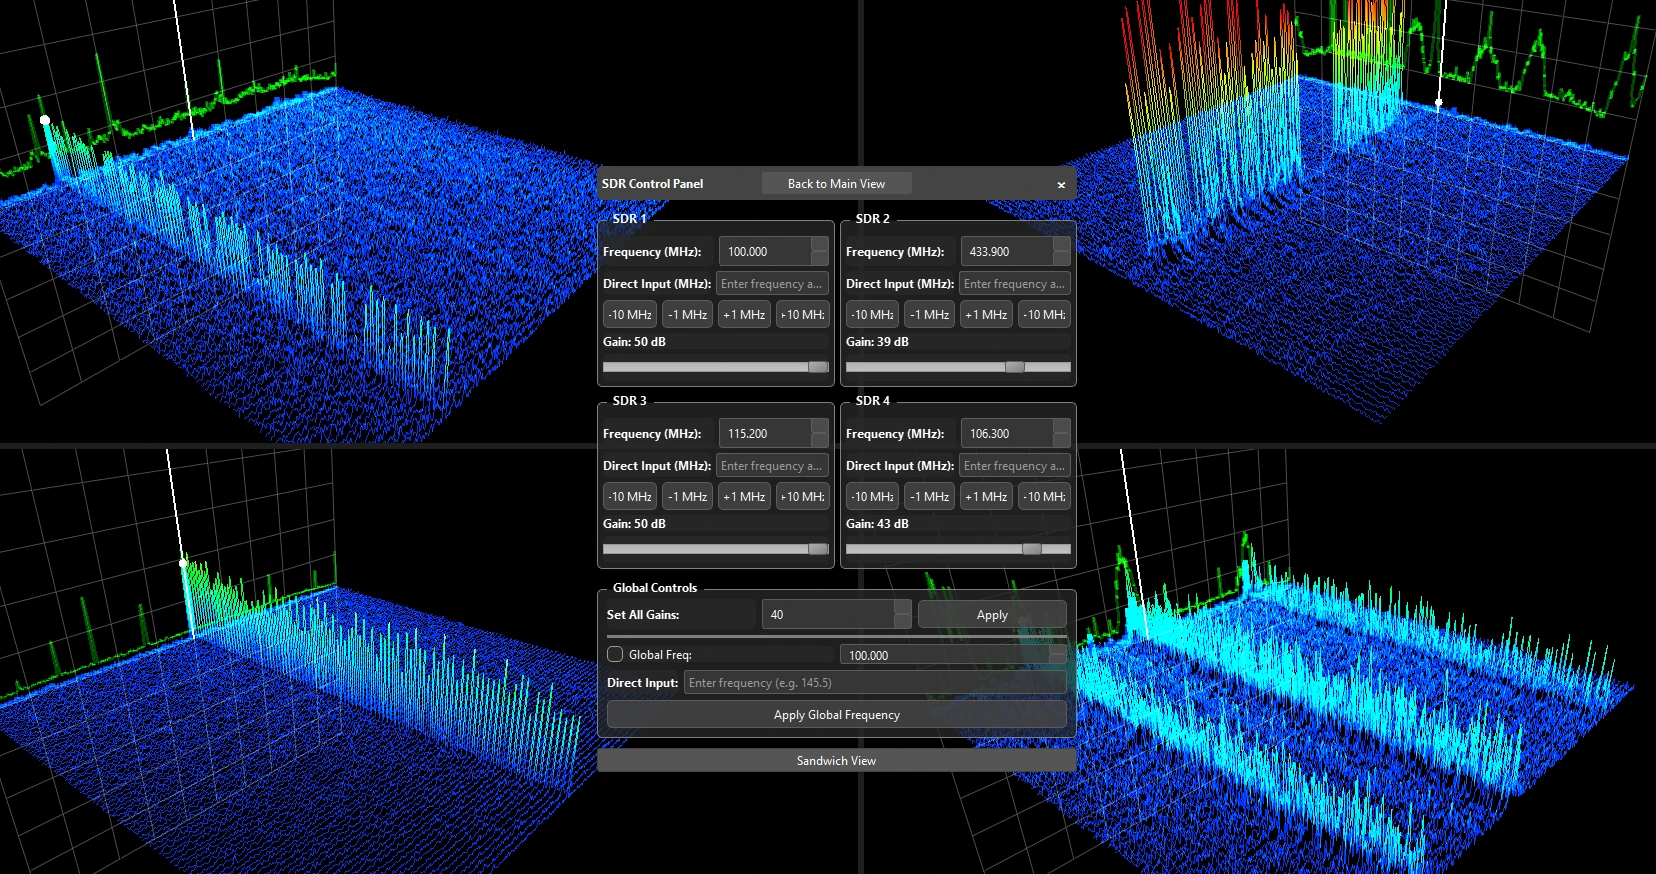
Quad 3D Spectrum Analyzer
3D visualization for four synchronized RTL-SDR devices with interactive controls.
Open Page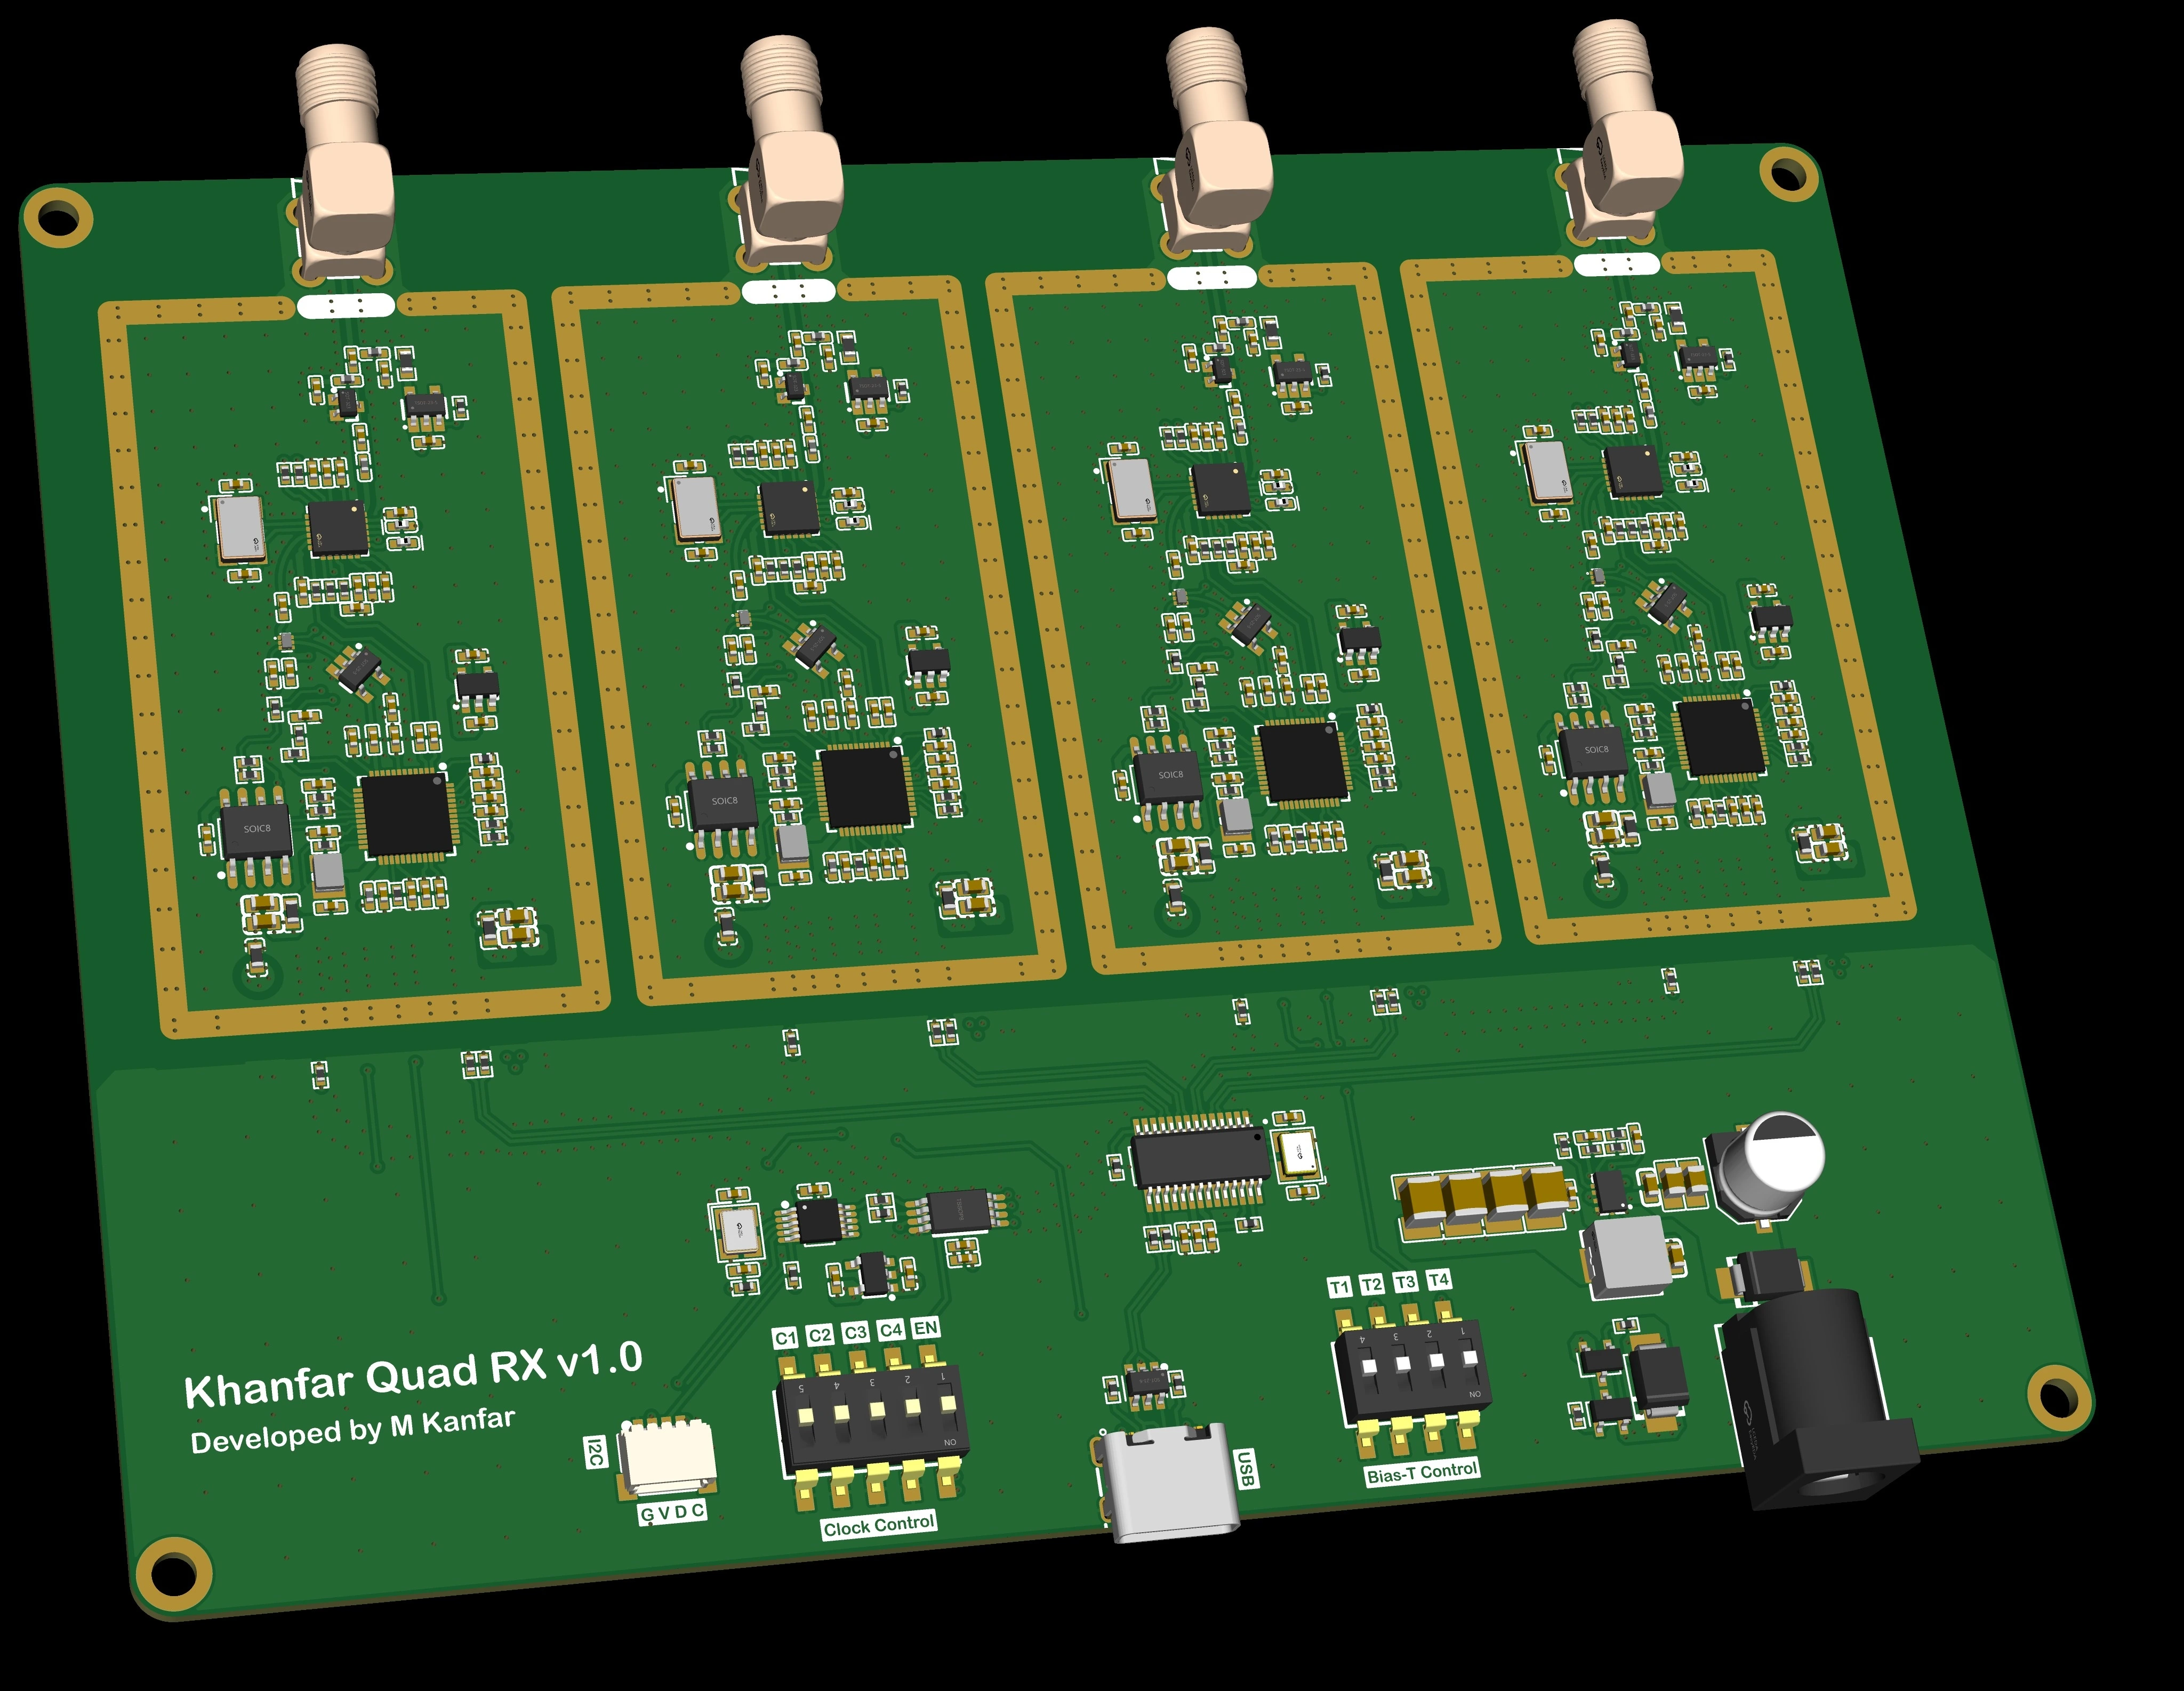
Khanfar Quad RX v1.0 Hardware
Four-channel synchronized RTL-SDR receiver board built for multi-SDR systems.
Open Page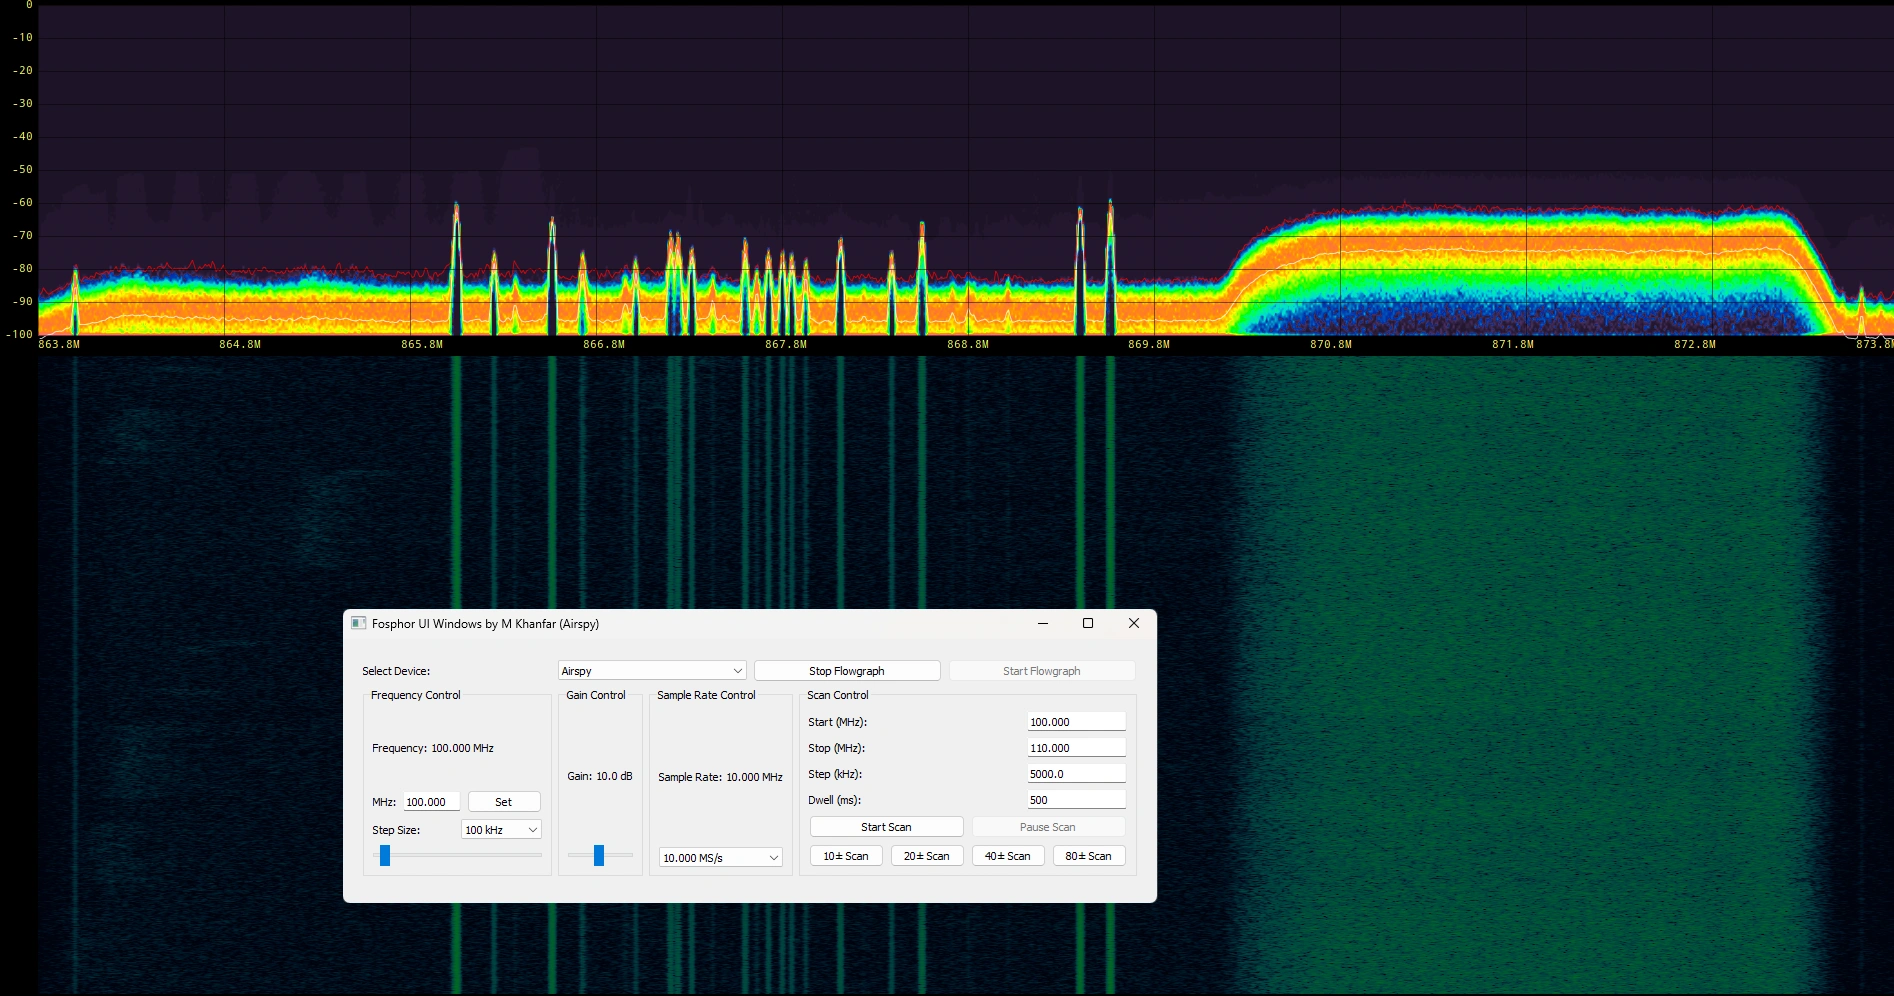
Fosphor Spectrum Visualization
GPU-accelerated real-time spectrum display built on GNU Radio Fosphor.
Open Page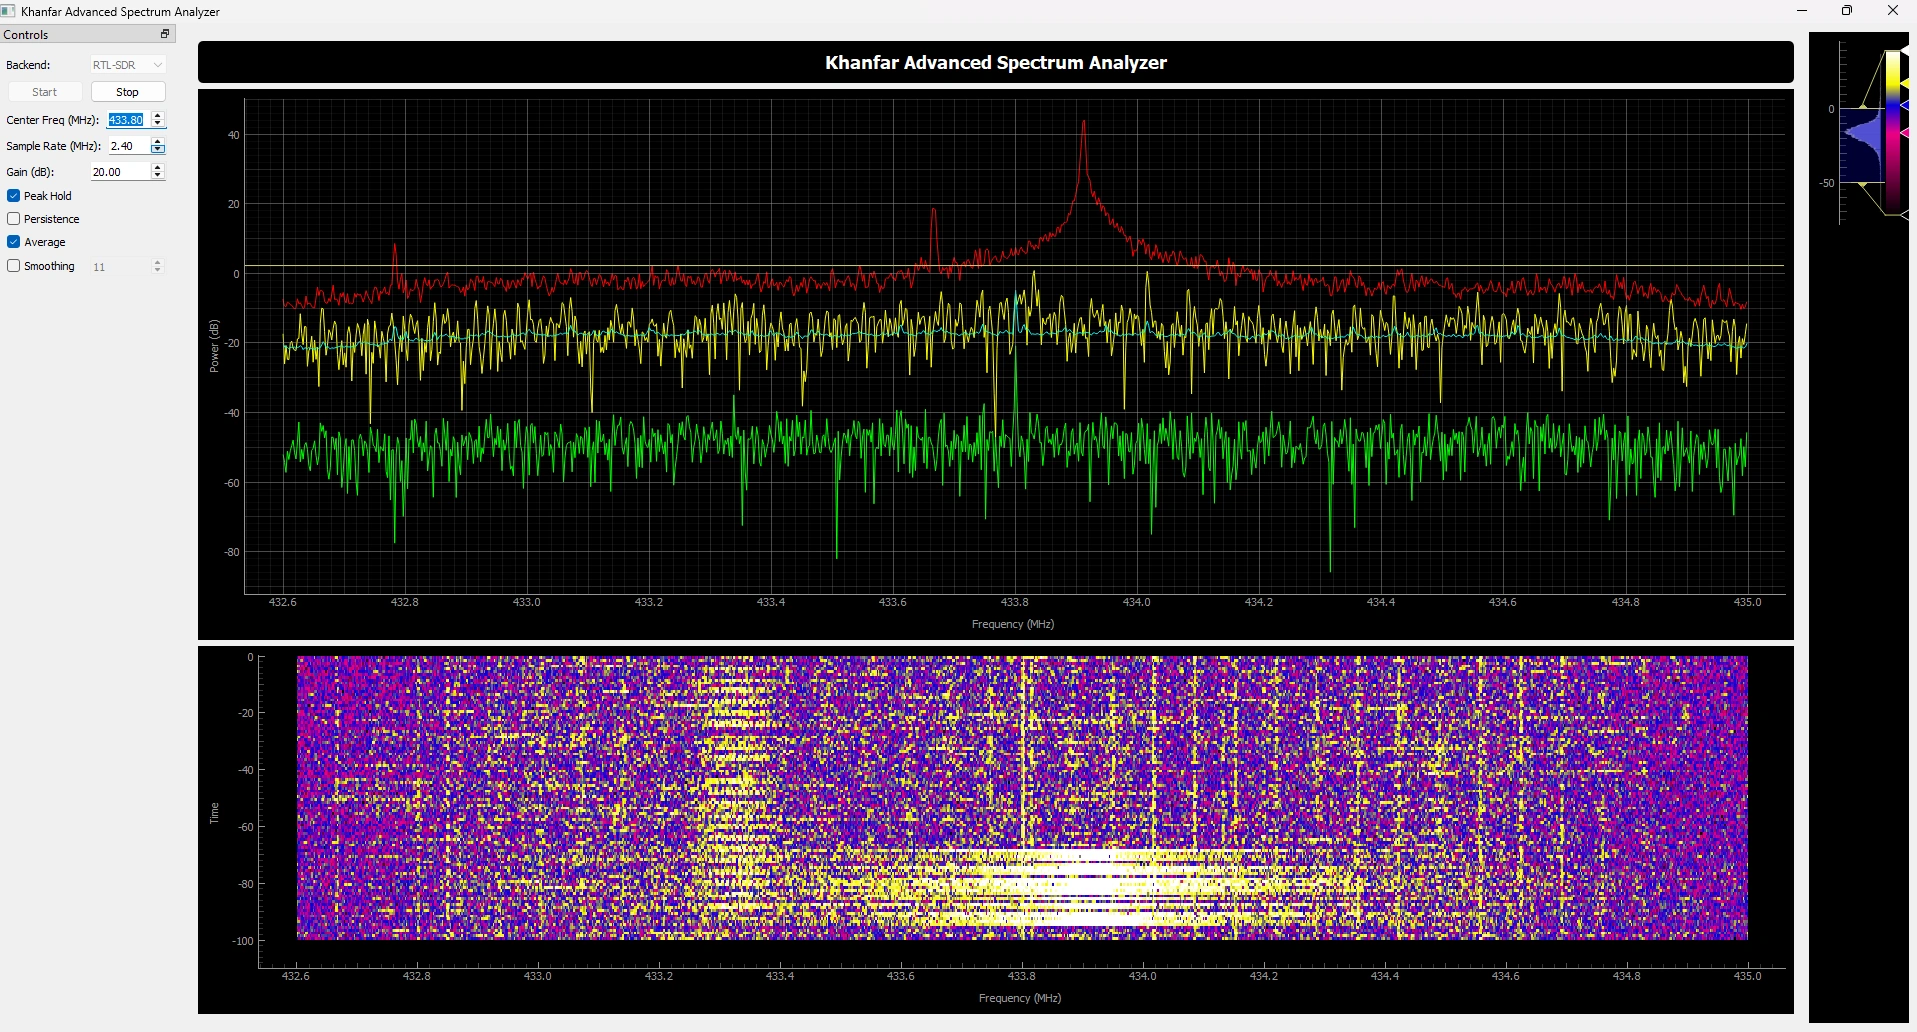
Khanfar Advanced Spectrum Analyzer
Advanced spectrum analyzer with expanded features for detailed RF inspection.
Open Page
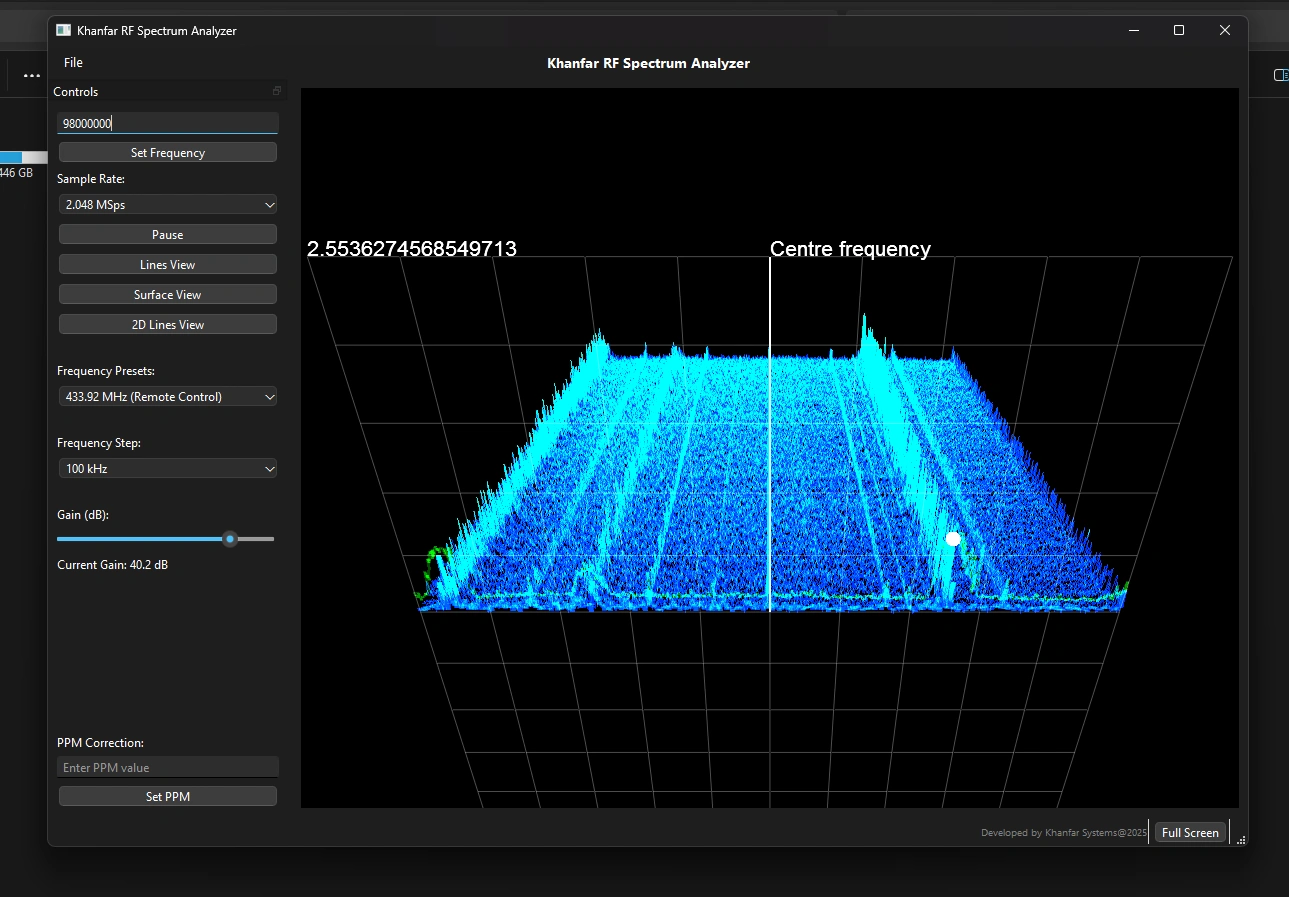
Khanfar Spectrum Analyzer
Flagship SDR analyzer with real-time FFT, waterfall displays, and multi-device support.
Open Page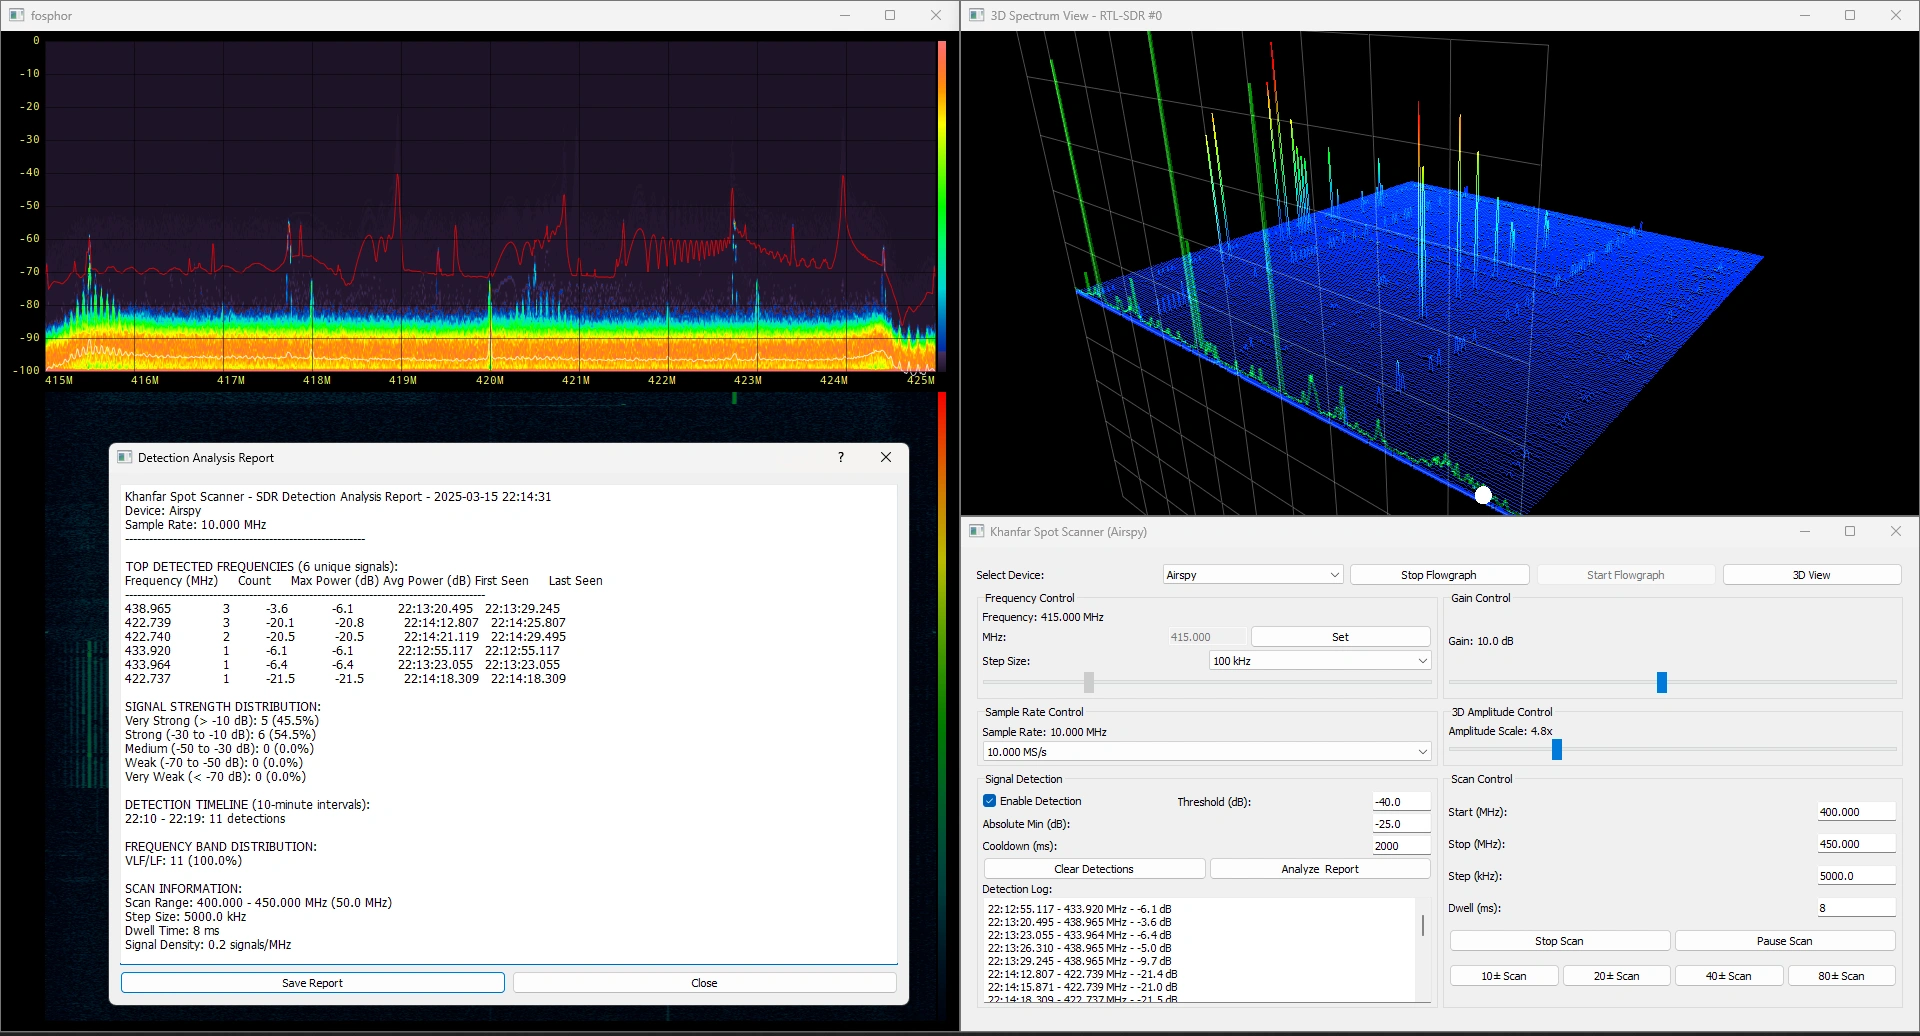
Khanfar Spot Scanner
Intelligent multi-SDR spectrum scanner with automated signal detection.
Open Page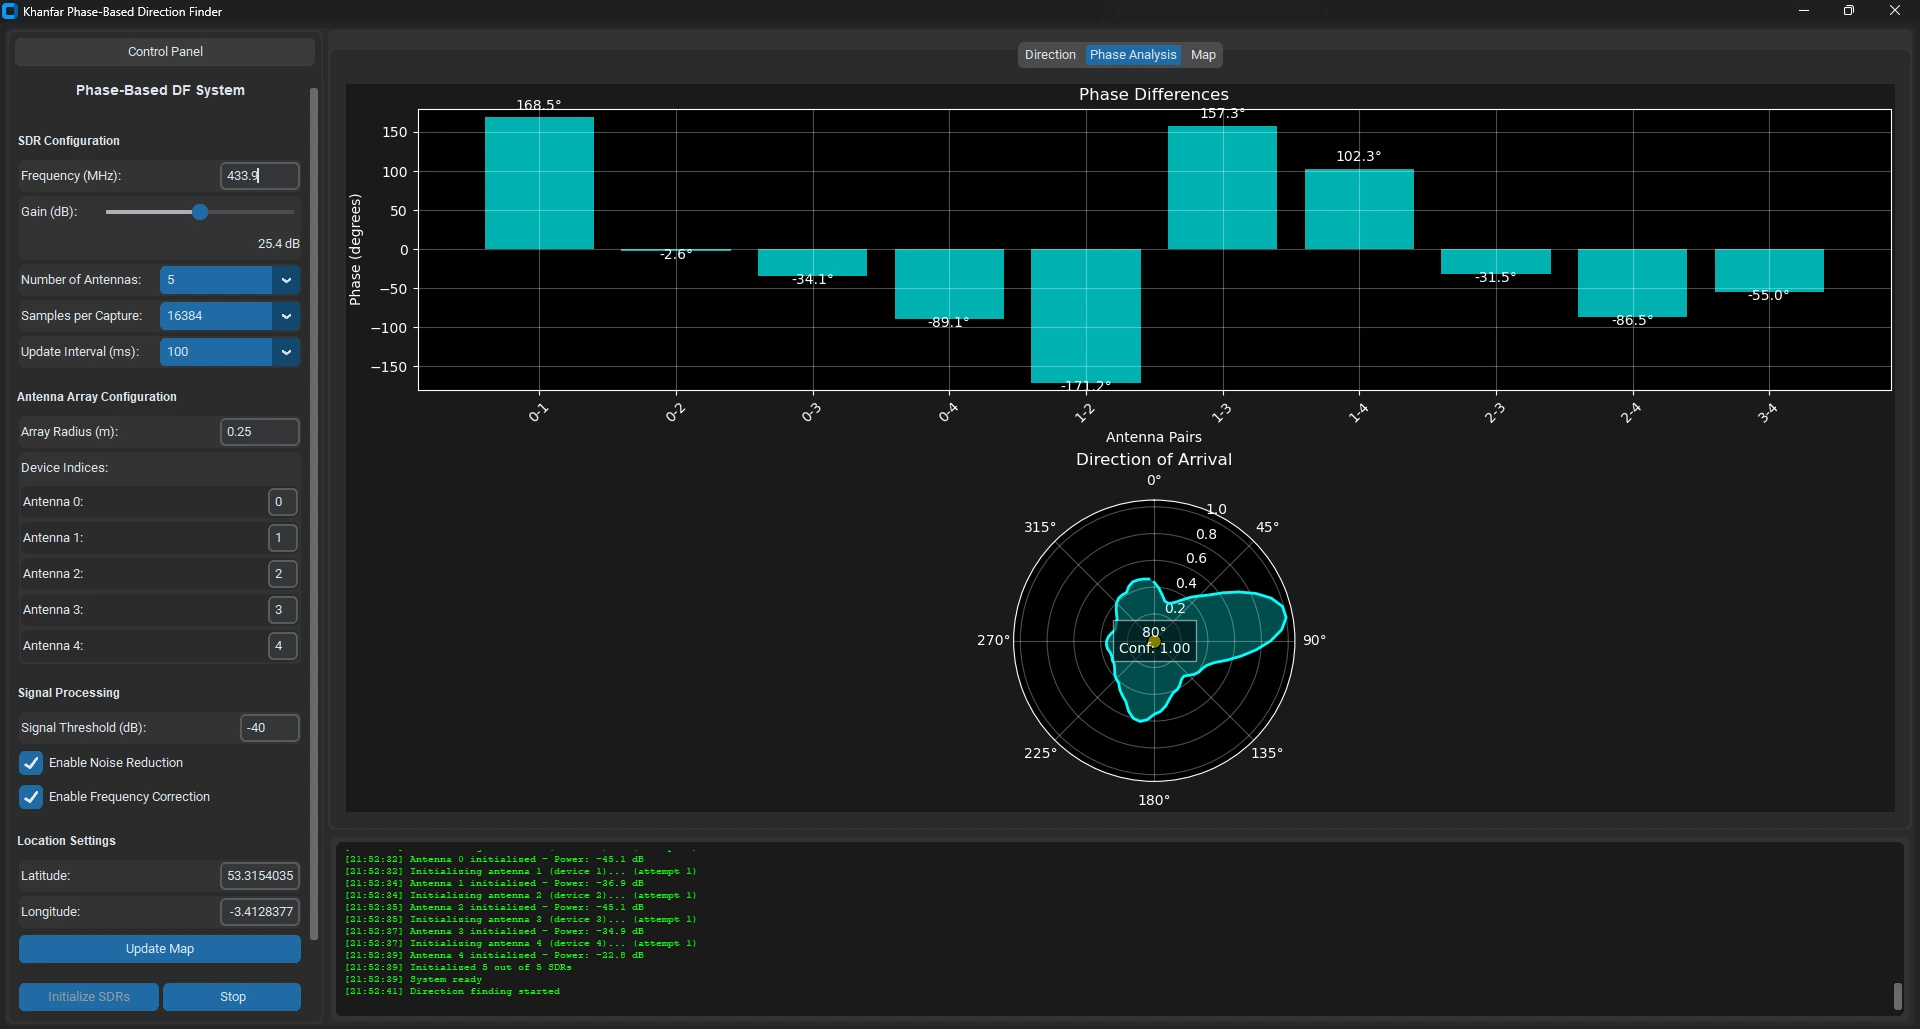
Khanfar Phase-Based Direction Finding
Phase-based DF system using multi-antenna arrays for accurate bearing.
Open Page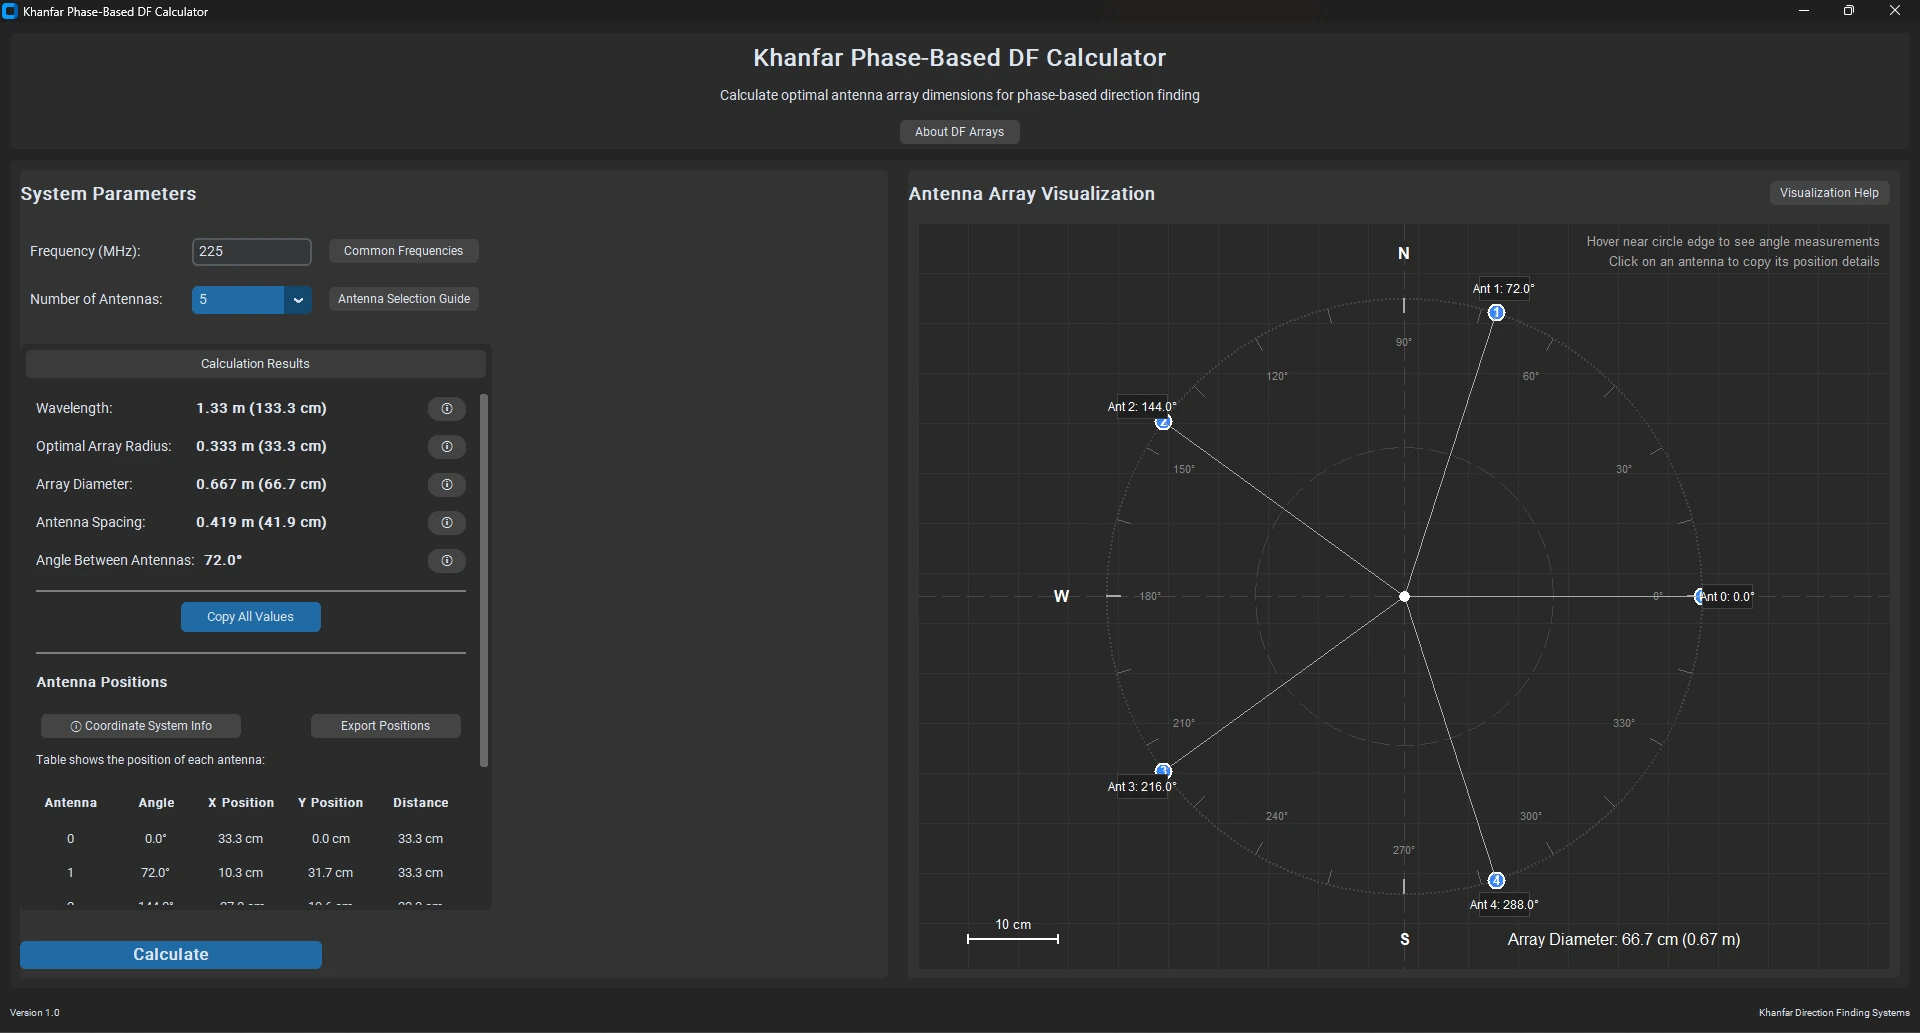
Khanfar Phase-Based DF Calculator
Design tool for optimal circular antenna arrays for phase-based DF.
Open Page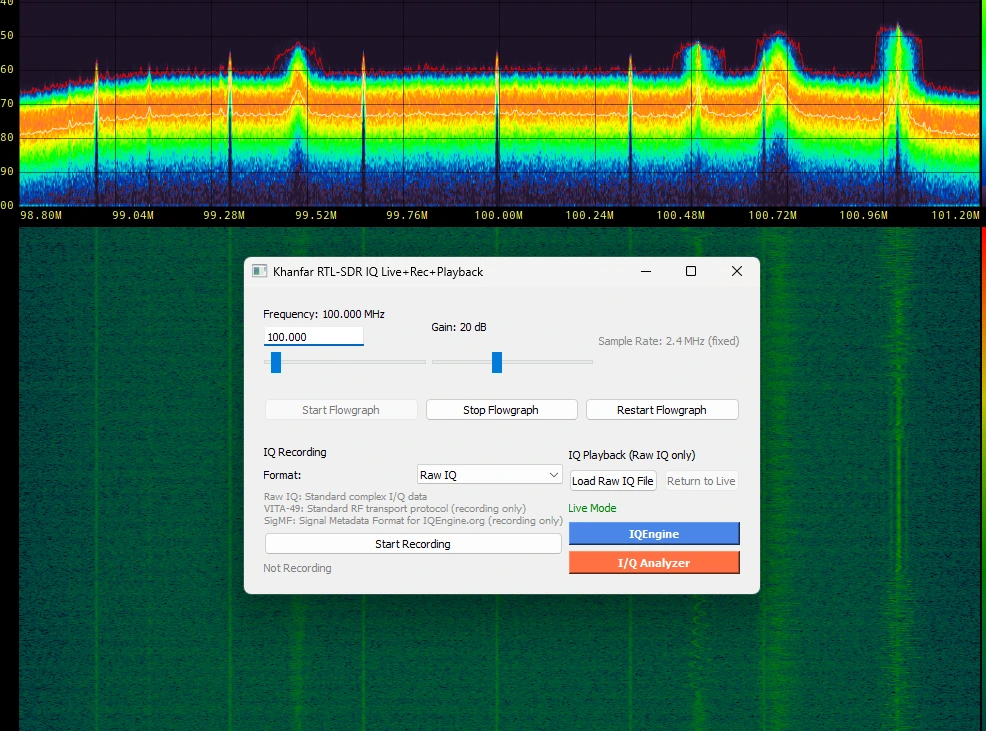
Khanfar IQ Live-Rec-Playback
Professional IQ recording, playback, and visualization for RTL-SDR.
Open Page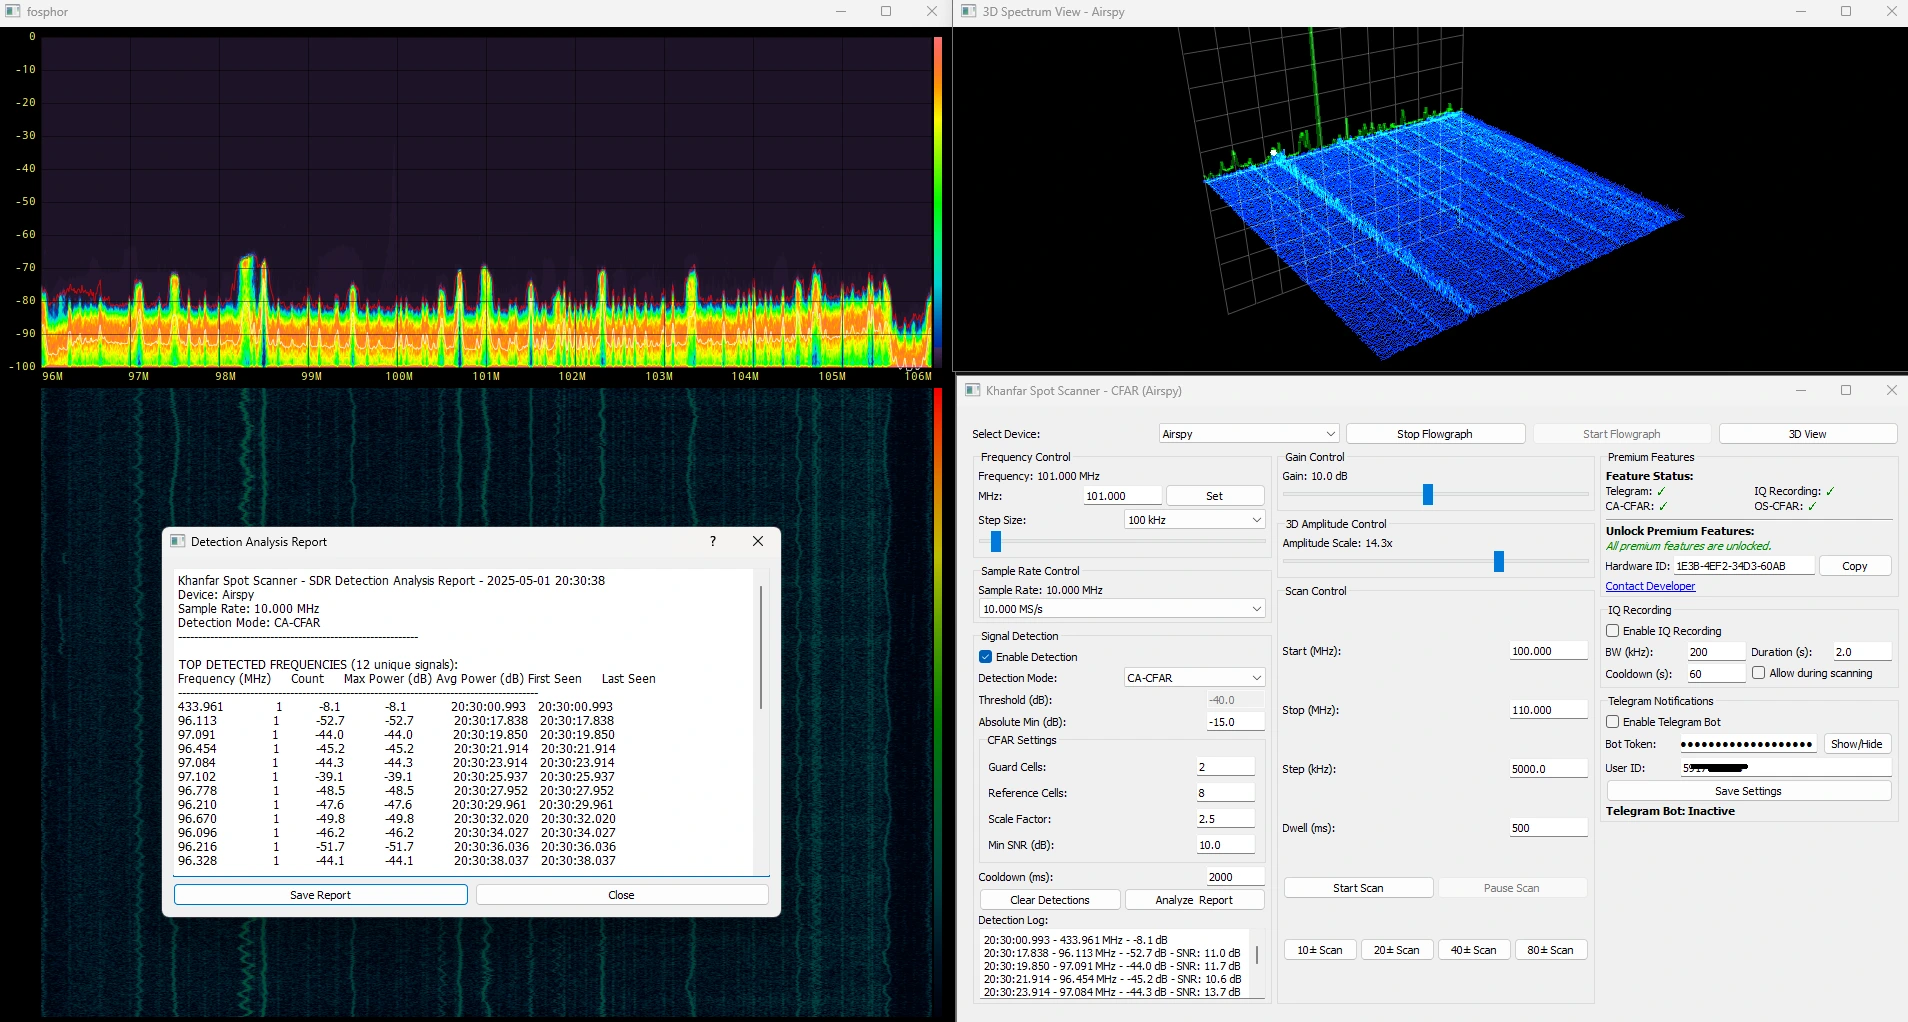
Khanfar Spot Scanner - CFAR Edition
CFAR-powered signal detection with advanced masking and analysis tools.
Open Page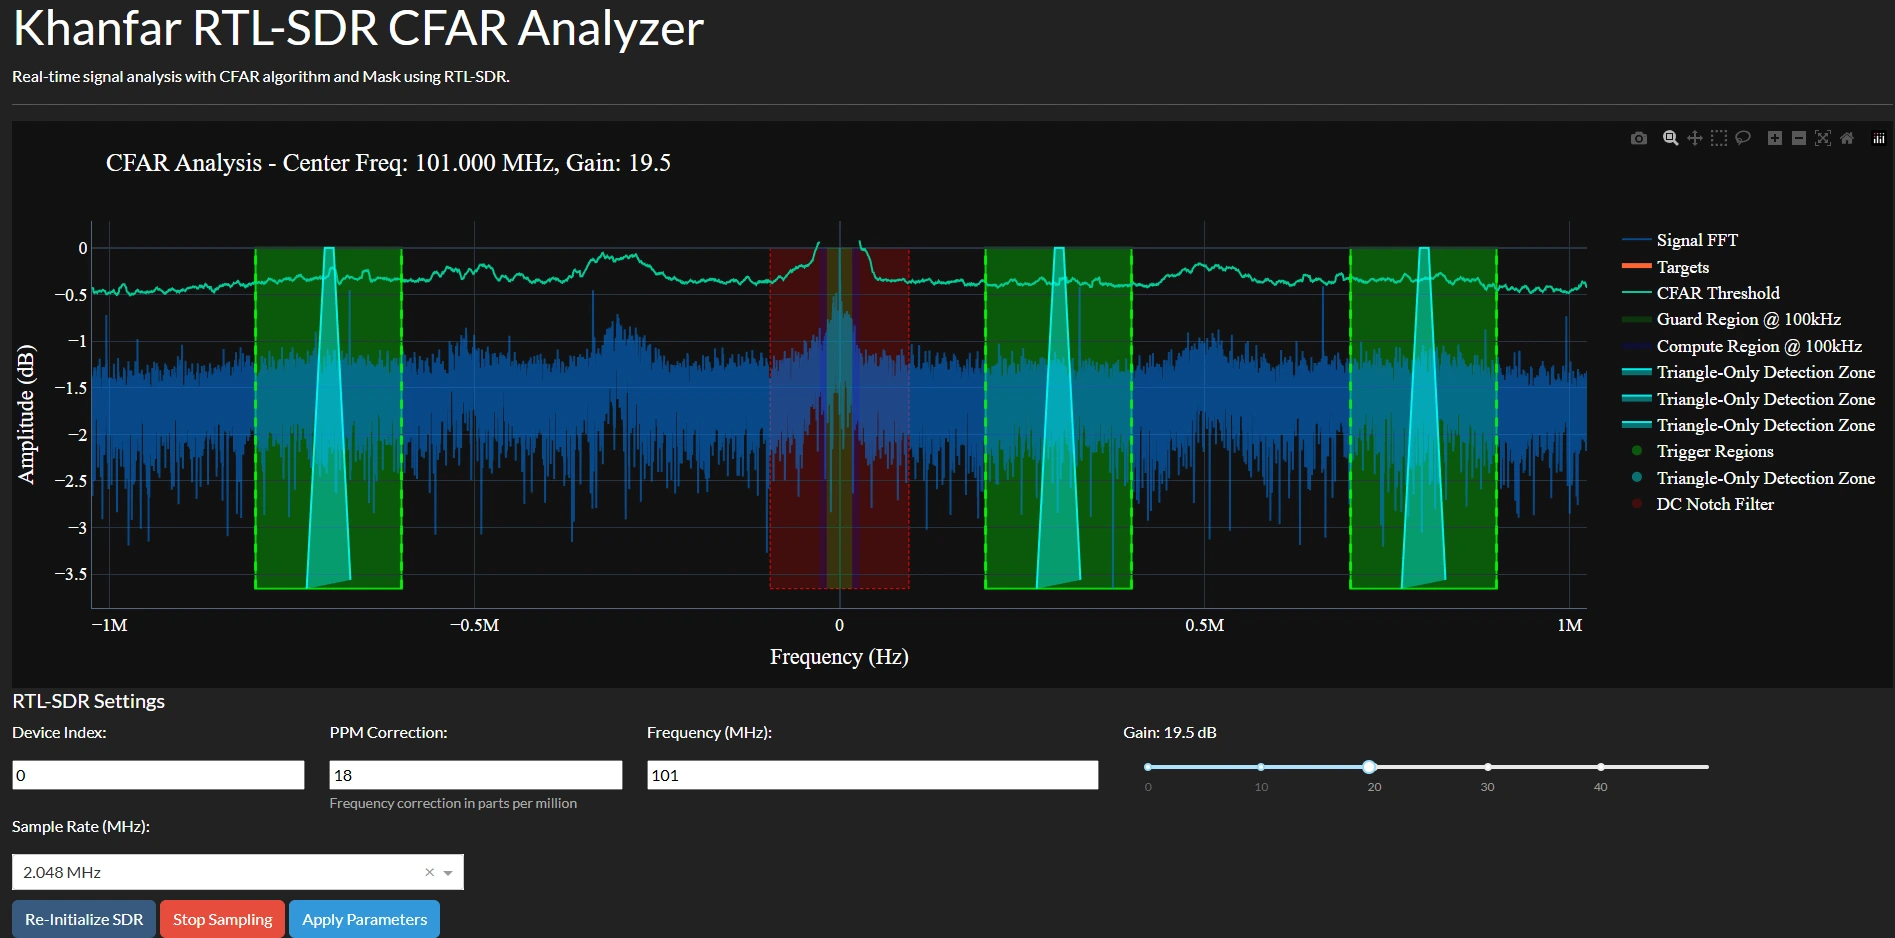
Khanfar RTL-SDR CFAR - Mask Analyzer
Advanced CFAR detection and frequency mask trigger tools for RTL-SDR.
Open Page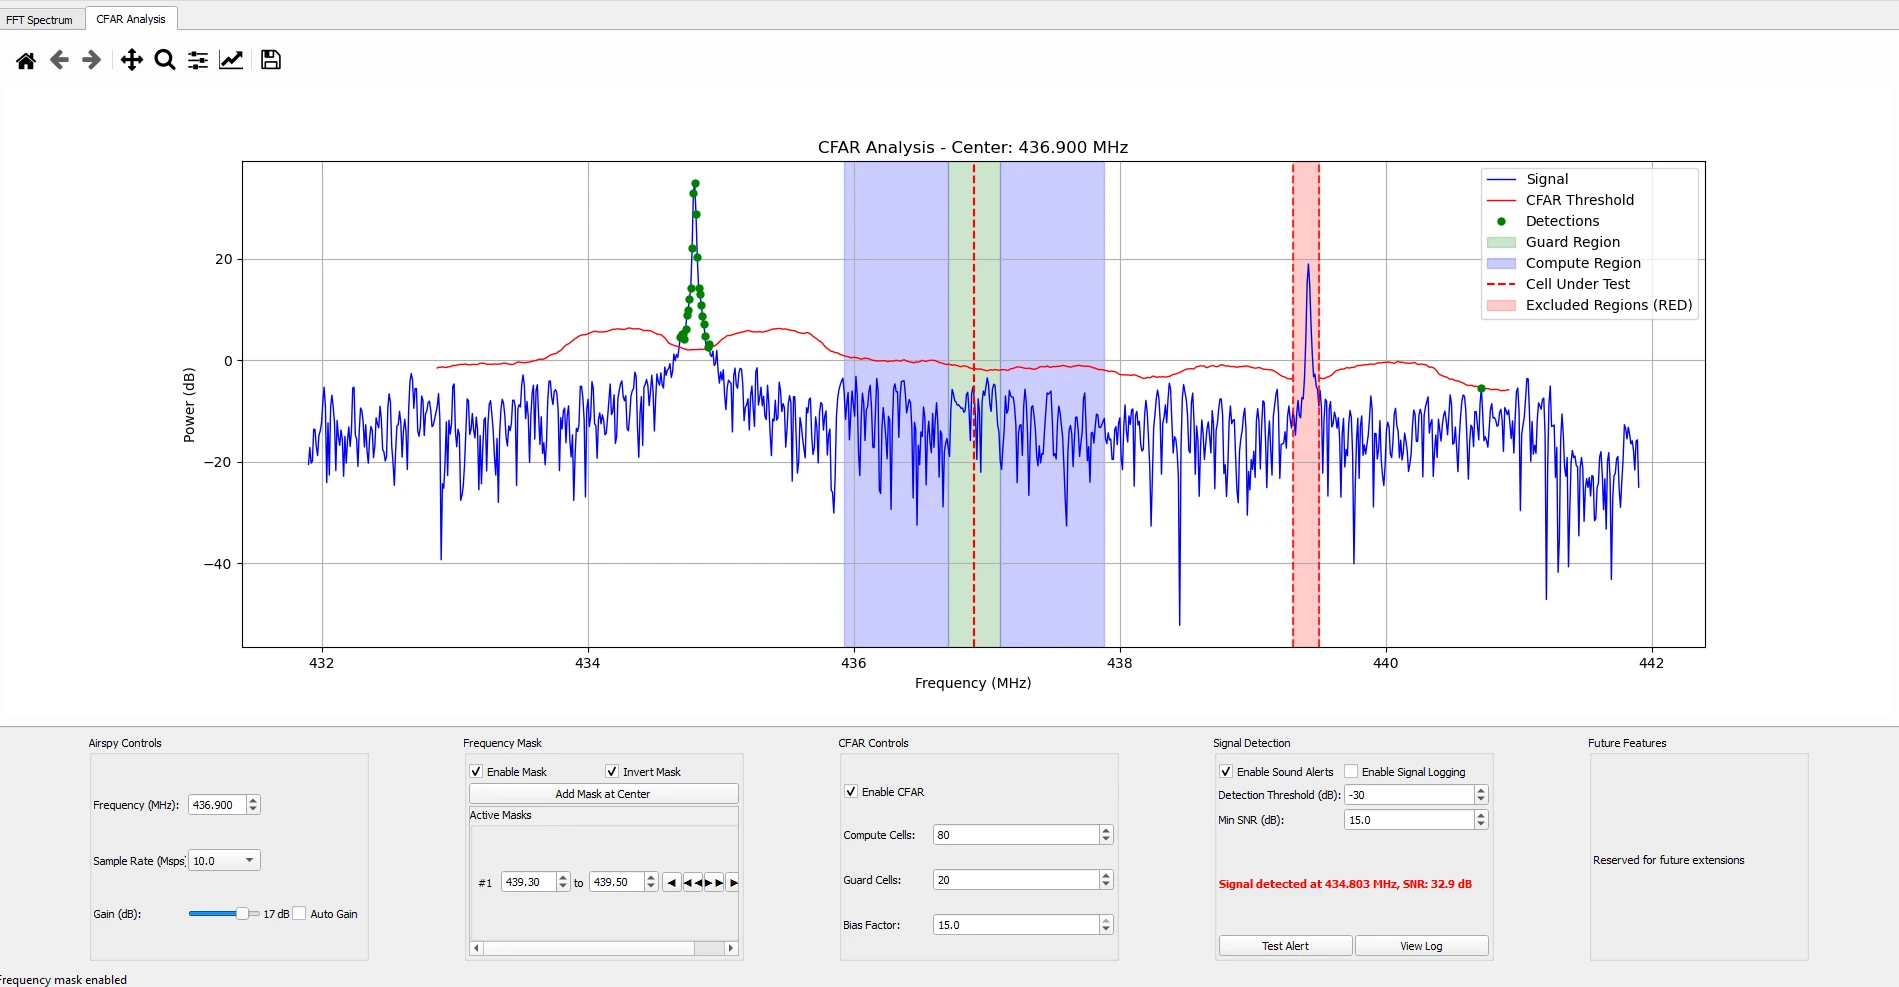
Airspy CFAR MASK Analyzer
CFAR-based mask analyzer designed specifically for Airspy SDR devices.
Open Page
